High resolution models of transcription factor-DNA affinities improve in vitro and in vivo binding predictions
- PMID: 20838582
- PMCID: PMC2936517
- DOI: 10.1371/journal.pcbi.1000916
High resolution models of transcription factor-DNA affinities improve in vitro and in vivo binding predictions
Abstract
Accurately modeling the DNA sequence preferences of transcription factors (TFs), and using these models to predict in vivo genomic binding sites for TFs, are key pieces in deciphering the regulatory code. These efforts have been frustrated by the limited availability and accuracy of TF binding site motifs, usually represented as position-specific scoring matrices (PSSMs), which may match large numbers of sites and produce an unreliable list of target genes. Recently, protein binding microarray (PBM) experiments have emerged as a new source of high resolution data on in vitro TF binding specificities. PBM data has been analyzed either by estimating PSSMs or via rank statistics on probe intensities, so that individual sequence patterns are assigned enrichment scores (E-scores). This representation is informative but unwieldy because every TF is assigned a list of thousands of scored sequence patterns. Meanwhile, high-resolution in vivo TF occupancy data from ChIP-seq experiments is also increasingly available. We have developed a flexible discriminative framework for learning TF binding preferences from high resolution in vitro and in vivo data. We first trained support vector regression (SVR) models on PBM data to learn the mapping from probe sequences to binding intensities. We used a novel -mer based string kernel called the di-mismatch kernel to represent probe sequence similarities. The SVR models are more compact than E-scores, more expressive than PSSMs, and can be readily used to scan genomics regions to predict in vivo occupancy. Using a large data set of yeast and mouse TFs, we found that our SVR models can better predict probe intensity than the E-score method or PBM-derived PSSMs. Moreover, by using SVRs to score yeast, mouse, and human genomic regions, we were better able to predict genomic occupancy as measured by ChIP-chip and ChIP-seq experiments. Finally, we found that by training kernel-based models directly on ChIP-seq data, we greatly improved in vivo occupancy prediction, and by comparing a TF's in vitro and in vivo models, we could identify cofactors and disambiguate direct and indirect binding.
Conflict of interest statement
The authors have declared that no competing interests exist.
Figures

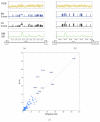
 -mer based string kernels. Probe sequences containing high affinity binding sites have high intensity in the PBM binding experiment; such probes are shown bound by the fluorescently tagged TF (left) and are indicated by green points in the SVR training (right). The SVR predicts probe intensity from probe sequence composition. The trained SVRs can be used to scan intergenic regions to predict in vivo TF occupancy.
 -axis) and the SVR model (
 -axis) in the prediction of in vitro TF binding preferences. Each point corresponds to one TF. The figure contains 37 yeast TFs from , 33 yeast TFs from (blue), and 114 mouse TFs from (red). (b) This panel is similar to panel (a), but compares the SVR versus PBM-derived PSSMs for the 114 mouse TFs.
 -axis) versus SVR (
 -axis) for yeast in vivo binding preferences as measured by detection of the top 200 IGRs by the top 200 predictions.

 -mers contributing to the (a) Oct4 PBM model and (b) Sox2 ChIP model, where each point represents a 13-mer and is colored according to its model weight (red for high weights, blue for low weights). Star and circle point styles indicate different clusters. For the PBM-derived model, the clusters appear to represent primary and secondary binding motifs, with the more degenerate motif perhaps arising as an artifact of the PBM experiment. For the ChIP-derived model, the clusters correspond to the motifs for Sox2 and its cofactor Oct4. (c) PBM-derived PSSMs for Sox12 and Pou2f3, downloaded from UniPROBE, and ChIP-derived PSSM for Sox2, computed using MDscan on the Sox2 ChIP-peak sequences (60bp long).
References
-
- Noble WS. Support vector machine applications in computational biology, MIT Press, chapter 3. Computational Molecular Biology. 2004 Available: http://www.amazon.com/exec/obidos/redirect?tag=citeulike07-20&path=ASIN/....
-
- Leslie C, Eskin E, Cohen A, Weston J, Noble WS. Mismatch string kernels for discriminative protein classification. Bioinformatics. 2004;20:467–76. - PubMed
Publication types
MeSH terms
Substances
Grants and funding
LinkOut - more resources
Full Text Sources
Molecular Biology Databases
Miscellaneous

