. 2010 Sep 9;6(9):e1001102.
doi: 10.1371/journal.pgen.1001102.

A central regulatory system largely controls transcriptional activation and repression responses to phosphate starvation in Arabidopsis

Affiliations

A central regulatory system largely controls transcriptional activation and repression responses to phosphate starvation in Arabidopsis

Regla Bustos et al. PLoS Genet. .

Abstract

Plants respond to different stresses by inducing or repressing transcription of partially overlapping sets of genes. In Arabidopsis, the PHR1 transcription factor (TF) has an important role in the control of phosphate (Pi) starvation stress responses. Using transcriptomic analysis of Pi starvation in phr1, and phr1 phr1-like (phl1) mutants and in wild type plants, we show that PHR1 in conjunction with PHL1 controls most transcriptional activation and repression responses to phosphate starvation, regardless of the Pi starvation specificity of these responses. Induced genes are enriched in PHR1 binding sequences (P1BS) in their promoters, whereas repressed genes do not show such enrichment, suggesting that PHR1(-like) control of transcriptional repression responses is indirect. In agreement with this, transcriptomic analysis of a transgenic plant expressing PHR1 fused to the hormone ligand domain of the glucocorticoid receptor showed that PHR1 direct targets (i.e., displaying altered expression after GR:PHR1 activation by dexamethasone in the presence of cycloheximide) corresponded largely to Pi starvation-induced genes that are highly enriched in P1BS. A minimal promoter containing a multimerised P1BS recapitulates Pi starvation-specific responsiveness. Likewise, mutation of P1BS in the promoter of two Pi starvation-responsive genes impaired their responsiveness to Pi starvation, but not to other stress types. Phylogenetic footprinting confirmed the importance of P1BS and PHR1 in Pi starvation responsiveness and indicated that P1BS acts in concert with other cis motifs. All together, our data show that PHR1 and PHL1 are partially redundant TF acting as central integrators of Pi starvation responses, both specific and generic. In addition, they indicate that transcriptional repression responses are an integral part of adaptive responses to stress.


Conflict of interest statement

The authors have declared that no competing interests exist.

Figures
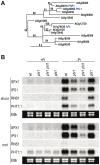
Figure 1
Figure 1. Functional redundancy of PHR1 and PHL1 in Pi starvation responsiveness of gene expression.
(A) Phylogram of MYB-CC proteins from Arabidopsis, constructed using the Phylogeny-fr platform (www.phylogeny.fr) . In addition to the AGI number, names are given for the functionally characterized members: PHOSPHATE STARVATION RESPONSE REGULATOR 1 (PHR1) ; PHR1-LIKE1 (PHL1; this study) ALTERED PHLOEM DEVELOPMENT (APL) . The bootstrap value of each node is indicated (100 samples); nodes with bootstrap value <50 were collapsed. Only the conserved MYB and coiled-coil domains were used for alignment (Figure S1) and tree construction. (B) Northern analysis of the effect of phr1 and phl1 mutations on the expression of Pi starvation-responsive marker genes. Plants were grown for 7 days in Pi-rich or -lacking medium; RNA from roots and shoots was isolated separately and blots were hybridised sequentially to the probes PHT1;1, RNS1, IPS1, and SPX1. Ethidium bromide-stained rRNA was used as loading control.
Figure 2
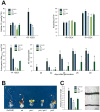
Figure 2. Effect of phr1 and phl1 mutations and PHR1 overexpression on physiological responses to Pi starvation.
(A) Histograms of metabolic (Pi and anthocyanin content) and developmental (root/shoot fresh weight ratio and number of siliques per plant) parameters of wild type (wt), phr1, phl1, and phr1 phl1 mutants, and GR:PHR1 overexpression line (OxPHR1). For analysis of Pi content, plants were grown for 12 days in complete medium (+Pi) and +Pi supplemented with 5 µM dexamethasone (+Pi+DEX). Anthocyanin content was measured in plants grown for 12 days in Pi-lacking medium supplemented with 5 µM DEX (−Pi+DEX). Root/shoot fresh weight (FW) ratio was measured in plants grown for 10 days in +Pi medium, and then transferred for 6 days to +Pi+DEX or −Pi+DEX media. Number of siliques was scored in plants grown for 9 days in +Pi and transferred to −Pi+DEX. Day 0 corresponds to start of germination. (B) Phenotypes of wild type, phr1, phl1, and phr1 phl1 plants, and a OxPHR1 line grown for 9 days in complete medium, then transferred to −Pi+DEX for 13 days. The image reflects a phenotype frequent at the time examined. (C) Root hair size of wild type, phr1, phl1, and phr1 phl1 plants, and a OxPHR1 line (left) and a detail (right) showing root hairs of wild type (top) and phr1 phl1 plants (bottom). Plants were grown in vertical plates for 12 days in Pi-lacking medium. Scale bar, 0.5 mm. Asterisks indicate significant differences with wild type (p<0.05, Student's t-test).
Figure 3
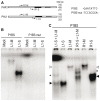
Figure 3. DNA-binding and dimerisation properties of PHL1.
(A) Diagram showing the PHR1 and PHL1 proteins, including MYB (black) and the predicted coiled-coil domains (grey), indicating the start of the N-terminally truncated versions of PHR1 (medium-length PHR1, R1-M; short PHR1, R1-S) and PHL1 (medium-length PHL1, L1-M; short PHL1, L1-S) used (left). The core sequence of the oligonucleotide containing the PHR1 binding sequence (P1BS) and the mutated version (P1BS mut) are shown (right). (B) EMSA showing binding to P1BS, but not to its mutant version, of N-terminal forms of PHL1. (C) PHL1 dimerisation determined by EMSA with the two N-terminally truncated versions of PHL1 and PHR1. Proteins were translated in vitro alone or in combination. Arrows show the position of the homodimers formed with short (closed arrows) and medium-length proteins (open arrows); asterisks show the position of homo- or heterodimers formed by the combination of short and medium-length proteins. A mock translation mixture (Mock) was used as control.
Figure 4
Figure 4. P1BS distribution over different gene parts of PHR1 direct targets and Pi starvation-responsive genes.
(A) P1BS content per gene in different gene parts (distal promoter region, 3-1 kb prom; proximal promoter region, 1kb prom; 5′UTR, coding region, CDS; Intron; 3′UTR; proximal downstream region, 1 kb downs; distal downstream region, 1–3 kb downs) (left) and proportion of genes lacking P1BS in any of these gene parts (right). The P1BS content of the average Arabidopsis genes, represented in the Affimetrix chip used in transcriptomic analyses, is taken arbitrarily as 1. (B) Average number of other stresses in which Pi starvation-induced genes are also induced relative to the number of P1BS motifs in the 1 kb proximal promoter region. Data for induction by other stress types were obtained from 28 stress conditions for which transcriptomic data were available in the GENEVESTIGATOR database (https://www.genevestigator.com) . Asterisks in A and B represent significant differences (p<0.01 using the χ2 test). (C) Relation between the number of P1BS motifs in the 1 kb promoter proximal region and log2 x-fold induction. The number of P1BS/gene (No P1BS/gene) was calculated as the average content of P1BS motifs over successive sets of 30 genes, measured at a one-gene interval, ordered according to inducibility by Pi starvation.
Figure 5
Figure 5. P1BS is a key cis-regulatory motif in Pi starvation responsiveness.
(A) Diagram shows IPS1:GUS and RNS1:GUS reporter genes and mutated versions thereof. The P1BS motifs in each gene are highlighted with a vertical bar (wild type, black; mutant, red). (B,C) Histochemical analysis of GUS activity driven by wild type and mutated versions of the IPS1:GUS reporter gene in plants grown in +Pi or −Pi media (B), or driven by wild-type and a mutated version of the RNS1:GUS reporter gene in plants grown in +Pi and +Pi media after wounding (C). (D) Northern analysis of RNS1 gene expression in wild type and phr1, phl1, and phr1 phl1 mutants in response to Pi starvation or wounding. Ethidium bromide-stained rRNA was used as loading control. For the Pi starvation experiment, plants were grown for 7 days in +Pi or −Pi media and RNA prepared from shoots. For the wounding experiment, plants were grown for 14 days, and wounded and unwounded control leaves were harvested for histochemical analysis of GUS activity and for RNA isolation 8 h after wounding.
Figure 6
Figure 6. P1BS is an integrator cis motif in Pi starvation signalling.
(A–C) Histochemical analysis of GUS activity driven by IPS1:GUS (IPS1) and 4xP1BS:GUS, a reporter gene containing a synthetic promoter harbouring four tandem copies of P1BS fused to the −46 minimal 35S promoter from CaMV (4xP1BS). (A) Response of reporter genes to different types of nutrient starvation stress and to salt and osmotic stress. Plants were grown for 7 days in +Pi or −Pi medium, or media lacking potassium (−K), nitrogen (−N) or sulphur (−S). The effect of saline and osmotic stress was analysed in plants grown for 7 days in complete media supplemented with 150 mM NaCl (NaCl) or 300 mM mannitol (Man), respectively. (B) Response of reporter genes to known agonists (sucrose) or antagonists (cytokinins, arsenate) of the Pi starvation response. To analyse the effect of sucrose, plants were grown for 7 days in +Pi medium in low sucrose (0.1%) and transferred for 3 days to −Pi medium containing two concentrations of sucrose (0.1% or 3%; left). To examine the cytokinin effect, plants were grown for 5 days in −Pi medium, alone or with 2 µM kinetin (Kin; centre). Plants (right) were grown for 7 days in complete liquid medium and transferred for 4 days to +Pi or −Pi media alone or with 30 µM arsenate [As(V)]. (C) Response of reporter genes to long distance repression in a split root assay. Plants were grown for 7 days in complete medium, for 4 additional days on −Pi medium, then transferred for 4 days to split plates with compartments containing +Pi or −Pi media as indicated. (D) Model showing the integrator role of P1BS and consequently PHR1(-like) in Pi starvation signalling.
Figure 7
Figure 7. Phylogenetic footprinting and mutational analysis of the IPS1 promoter.
(A) Alignment of the promoter region of IPS1 from five Brassicaceae species (Arabidopsis thaliana, Descurainia sophia, Brassica intermedia, Arabis auriculata and Lepidium campestre), which is conserved in the highly related At4 gene. A consensus sequence is shown indicating conservation of P1BS closely linked to motif B in the promoter of more distant IPS1-related genes from Arabidopsis and from other species (Medicago truncatula, Solanum lycopersicum, Populus trichocarpa and Zea mays). Conserved regions between IPS1 orthologs and At4 are boxed; the P1BS1 and B motifs conserved in distantly related IPS1 family members are shown in green and blue, respectively. The P1BS2 motif conserved only among IPS1 orthologues is highlighted (pale green). (B) Diagram shows different IPS1 promoter-derived reporter constructs: wild type 1 kb IPS1 promoter region (IPS1 wt), including P1BS (green boxes), motif B (blue box) and motifs A, C, D and E (black boxes); a 42-bp IPS1 promoter fragment (A-P1BS-B), including motifs A, P1BS1 and B; four tandem copies of motif B (4xB). Both A-P1BS-B and 4xB were fused to the −46 minimal promoter from the CaMV 35S gene fused to the coding region of the GUS reporter; versions of the IPS1 promoter with either motif A or motif B mutated (red boxes) were fused to the coding region of the GUS reporter. (C) Histochemical analysis of GUS activity driven by wild type IPS1:GUS and derived reporter constructs. Plants were grown for 7 days in +Pi or −Pi media.

References

    1. Dixon RA, Paiva NL. Stress-Induced Phenylpropanoid Metabolism. Plant Cell. 1995;7:1085–1097. - PMC - PubMed
    1. Mol J, Jenkins G, Schäfer E, Weiss D. Signal perception, transduction, and gene expression involved in anthocyanin. Crit Rev Plant Sci. 1996;15:525–557.
    1. Lim PO, Kim HJ, Nam HG. Leaf senescence. Annu Rev Plant Biol. 2007;58:115–136. - PubMed
    1. Ma S, Bohnert HJ. Integration of Arabidopsis thaliana stress-related transcript profiles, promoter structures, and cell-specific expression. Genome Biol. 2007;8:R49. - PMC - PubMed
    1. Walley JW, Coughlan S, Hudson ME, Covington MF, Kaspi R, et al. Mechanical stress induces biotic and abiotic stress responses via a novel cis-element. PLoS Genet. 2007;3:1800–1812. - PMC - PubMed

Publication types

MeSH terms