. 2010 Sep 9;6(9):e1001110.
doi: 10.1371/journal.pgen.1001110.

Incremental genetic perturbations to MCM2-7 expression and subcellular distribution reveal exquisite sensitivity of mice to DNA replication stress

Affiliations

Incremental genetic perturbations to MCM2-7 expression and subcellular distribution reveal exquisite sensitivity of mice to DNA replication stress

Chen-Hua Chuang et al. PLoS Genet. .

Abstract

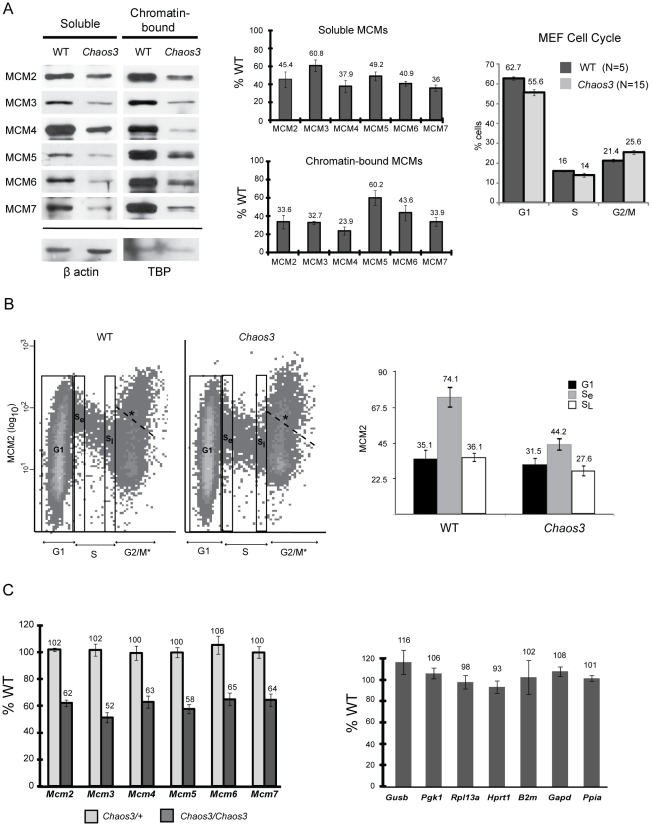
Mutations causing replication stress can lead to genomic instability (GIN). In vitro studies have shown that drastic depletion of the MCM2-7 DNA replication licensing factors, which form the replicative helicase, can cause GIN and cell proliferation defects that are exacerbated under conditions of replication stress. To explore the effects of incrementally attenuated replication licensing in whole animals, we generated and analyzed the phenotypes of mice that were hemizygous for Mcm2, 3, 4, 6, and 7 null alleles, combinations thereof, and also in conjunction with the hypomorphic Mcm4(Chaos3) cancer susceptibility allele. Mcm4(Chaos3/Chaos3) embryonic fibroblasts have ∼40% reduction in all MCM proteins, coincident with reduced Mcm2-7 mRNA. Further genetic reductions of Mcm2, 6, or 7 in this background caused various phenotypes including synthetic lethality, growth retardation, decreased cellular proliferation, GIN, and early onset cancer. Remarkably, heterozygosity for Mcm3 rescued many of these defects. Consistent with a role in MCM nuclear export possessed by the yeast Mcm3 ortholog, the phenotypic rescues correlated with increased chromatin-bound MCMs, and also higher levels of nuclear MCM2 during S phase. The genetic, molecular and phenotypic data demonstrate that relatively minor quantitative alterations of MCM expression, homeostasis or subcellular distribution can have diverse and serious consequences upon development and confer cancer susceptibility. The results support the notion that the normally high levels of MCMs in cells are needed not only for activating the basal set of replication origins, but also "backup" origins that are recruited in times of replication stress to ensure complete replication of the genome.


Conflict of interest statement

The authors have declared that no competing interests exist.

Figures

Figure 1
Figure 1. MCM2-7 proteins and mRNA are reduced in Mcm4Chaos3/Chaos3 MEFs, particularly in early S phase.
(A) Western blot analysis of MCM2-7 (left panel). Soluble or chromatin-bound protein was electrophoresced on PAGE gels, electrotransferred, and the blots were immunolabeled with the indicated antibodies. The bands correspond to the predicted molecular weights of these proteins, and for MCM2, the identity of the band was verifed by RNAi knockdown and transient overexpression in NIH 3T3 cells. TBP = TATA box binding protein. Quantification of Western blot data by densitometry is shown in the center panel. The amounts relative to WT cells (after normalization to the controls) are plotted. Error bars represent SEM, derived from 4 replicate experiments. The rightmost panel graphs the results of flow cytometric analysis of unsynchronized MEF culture cell cycle profiles, based on DNA content. (B) Flow cytometric quantification of MCM2 content (fluorescence intensity of antibody staining) is plotted on the Y axis, vs DNA content on the X axis. Plotted at the right is the mean fluorescent intensity of the 3 gated (boxed) regions from the flow data. Se = early S phase; SL = late S phase. The labeled cell cycle stages are based on DNA content. However, because light scatter was inadequate to distinguish individual nuclei from clumped nuclei or artifactual structures, the 4c category (denoted G2/M*) contains events other than G2/M nuclei. *We drew a dashed line representing an arbitrary cutoff above which contains such undefined events. (C) qRT-PCR analysis of Mcm mRNAs (left panel) and control genes (right panel), in the three indicated genotypes of MEFs. Relative transcript levels were normalized to β-actin. Charted are the percent levels of the indicated RNAs in mutant compared to WT (considered to be 100%). At least 3 replicate cultures were analyzed for each genotype. Error bars are SEM. In all panels, the raw data shown are from MEFs established from littermates. Furthermore, the replicates involved MEFs from pairs of littermates. Chaos3 = Mcm4Chaos3/Chaos3; WT = +/+.
Figure 2
Figure 2. Mcm gene trap alleles and associated mRNA levels, peripheral blood micronuclei, and cancer frequency.
(A) Genomic structures of mutated Mcm genes. Indicated is the intron/exon structure of each gene (not to scale), the locations of the gene trap insertions, and qPCR primer locations. (B) qRT-PCR analyses of MEF mRNA from gene trap heterozygotes. Charted are the percent levels of the indicated RNAs in mutant compared to WT (considered to be 100%). For all but Mcm7, the data were obtained from at least 3 MEF cultures from different embryos. The Mcm7 data represents the average of three replicates from 1 MEF culture, hence there are no error bars. Otherwise, error bars show SEM. (C) Micronucleus levels in Mcm gene trap-bearing male mice. At least 5 animals were analyzed for each single gene trap mutant allele. The “2GT” (two gene trap) group contains: 4 mice doubly heterozygous for Mcm2Gt and Mcm3Gt (“Mcm2/3”), 4 Mcm2/4 mice, and 4 Mcm3/4 mice. The 3GT group contains: 4 Mcm2/3/4 mice, 1 Mcm2/3/6 mouse, 1 Mcm2/4/6 mouse, and 3 Mcm3/4/6 mice. The 4-5GT group contains: 3 Mcm2/3/4/6 mice, 1 Mcm2/3/6/7 mouse, and 2 Mcm2/3/4/6/7 mouse. SEM bars are shown.
Figure 3
Figure 3. Synthetic lethality and growth retardation between Mcm4Chaos3 and Mcm2, Mcm6 and Mcm7.
(A) Graphed are viability data from crosses presented in Figure S2, which includes statistics. Unless otherwise indicated, the values represent expected proportions of indicated genotypes that were present at wean. (B) Weights of surviving animals are graphed over time. SEM bars are shown.
Figure 4
Figure 4. Premature morbidity and cancer susceptibility in Mcm4Chaos3/Chaos3 Mcm2Gt/+ mice.
(A) Kaplan-Meier survival plot of the indicated genotypes. Animals of both sexes are combined. “C3” = Chaos3. (B) Spleen and liver histopathology of a Mcm4C3/C3 Mcm2Gt/+ male diagnosed with T cell leukemic lymphoma. i . H&E stained spleen. Neoplastic cells have abundant cytoplasm, 1–2 nucleoli and a high mitotic rate, consistent with lymphoblastic lymphoma. Bar = 20 µm. ii . Neoplastic cells in spleen demonstrate immunoreactivity with anti-CD3 (brown; immunoperoxidase staining with DAB chromogen & hematoxalin counterstain), indicating T lymphocytes. Bar = 200µm. iii . In spleen, immunoreactivity (brown) with anti-PAX-5 (a B cell marker) is limited to follicular remnants and scattered individual cells. Bar = 200 µm. iv . In liver, neoplastic cells surround central veins and expand sinusoids (see also Figure S4) and demonstrate immunoreactivity (brown) with the anti-CD3 T lymphocyte marker. Bar = 50 µm.
Figure 5
Figure 5. Rescue of phenotypes by Mcm3 hemizygosity.
(A) Heterozygosity for Mcm3Gt rescues the low viability of various mutant genotypes (asterisk indicates significance at P<0.05 by FET). The raw data are presented in Figure S4. (B) Male body weights of combination mutant mice. The weights of Mcm4Chaos3/Chaos3 Mcm2Gt/+ Mcm3Gt/+ mice are significantly higher (asterisk; P<0.01, Student's t-test) at 90 days than Mcm4Chaos3/Chaos3 Mcm2Gt/+ mice. Error bars represent SEM. (C) Mcm4Chaos3/Chaos3 Mcm2Gt/+ MEF proliferation defects are partially rescued by Mcm3 hemizygosity. The effect is significant after 6 days in culture (P<0.05, Student's t-test; Error bars represent SEM). (D) Micronucleus levels in Mcm4Chaos3/Chaos3 mice bearing additional gene trap alleles. At least 5 males were analyzed for each genotype. Error bars represent SEM. Asterisk indicates P<0.05 (student's t-test.) compared to Mcm4Chaos3/Chaos3 alone. (E) CD71+ reticulocyte ratios in mutant male mice. At least 5 animals were analyzed from each class. The samples are identical to those in “D”. All scored cells were anucleate peripheral blood cells Error bars represent SEM. Asterisks and “#” indicate P<0.05 (Student's t-test) when compared to Mcm4Chaos3/Chaos3 and Mcm4Chaos3/Chaos3 Mcm2Gt/+ cohorts, respectively. (F) Mcm2 hemizygosity decreases efficiency of reprogramming Mcm4Chaos3/Chaos3 MEFs into iPS cells, and Mcm3 hemizygosity significantly increases reprogramming efficiency. Two methods of quanitifying reprogramming were used as described in Materials and Methods. “Cell number” refers flow cytometric quantification of LIN28/SSEA1 double positive cells from primary cultures of reprogrammed MEFs. Relative reprogramming efficiencies were normalized to Mcm4Chaos3/Chaos3 MEFs (considered to be 100%). Error bars represent SEM. All samples within quantification class are significantly different from one another (P<0.05, Student's t-test). C3 = Mcm4Chaos3; M = Mcm.
Figure 6
Figure 6. Inhibition of Chaos3 cancers by MCM3 reduction.
(A) Kaplan-Meier graphs of cohorts of the indicated genotypes. C3 = Mcm4Chaos3; M# = Mcm#Gt. In the left panel, the experiment was terminated at 12 months, with ∼1/3 animals tumor-free and healthy at the time (see “B”). Unless otherwise indicated, the cohorts contained both sexes. (B) Pie charts of cancer types in mice from “A.” COD = cause of death; Unkn = unknown. Classification of cancer types was assigned during necropsy, not from histological analysis.
Figure 7
Figure 7. MCM3 regulates nuclear and chromatin-bound MCM levels.
(A) Predicted nuclear export sequences (NES) in mouse MCM3 (see text). (B) Western blot analysis of MCM2/3/4 in the indicated genotypes of MEFs. Three different protein fractions were examined, with the indicated (arrow) loading controls at the bottom. (C) qRT-PCR analysis of Mcm2-7 mRNAs in MEFs of the indicated genotypes. (D) Nuclear MCM2 dynamics during the cell cycle. The flow plot is of isolated nuclei stained for DNA content (PI = propidium iodide) on the X-axis, and MCM2 on the Y-axis. NIH3T3 cells show dramatically the decrease in nuclear MCM2 through S phase. Flow cytometric data from the 4 MEF genotypes indicated in the right panel were used to calculate two values, ΔG1 and ΔS. The regions for the calculation of these values are indicated, and the values plotted in the right panel. The G1 (1N DNA content) phase nuclei were divided into two equal groups based on MCM2 signal intensity (Y-axis): the lower half, considered to be early-G1, and the upper half, considered to be late-G1. The ΔG1 value was calculated as the difference between the early and late MCM2 signal intensity averages. The ΔS value was calculated as : (average MCM2 intensity in the S population) – (early G1 average intensity). C3 = Mcm4Chaos3; M = Mcm. C3 is set at 100%. The asterisk indicates significance by Student's t-test (P<0.05).

References

    1. Gilbert DM. Making sense of eukaryotic DNA replication origins. Science. 2001;294:96–100. - PMC - PubMed
    1. Blow JJ, Dutta A. Preventing re-replication of chromosomal DNA. Nat Rev Mol Cell Biol. 2005;6:476–486. - PMC - PubMed
    1. Lei M. The MCM complex: its role in DNA replication and implications for cancer therapy. Curr Cancer Drug Targets. 2005;5:365–380. - PubMed
    1. Forsburg SL. Eukaryotic MCM proteins: beyond replication initiation. Microbiol Mol Biol Rev. 2004;68:109–131. - PMC - PubMed
    1. Tye BK. MCM proteins in DNA replication. Annu Rev Biochem. 1999;68:649–686. - PubMed

Publication types

MeSH terms