

Molecular biomarker analyses using circulating tumor cells
- PMID: 20838621
- PMCID: PMC2935889
- DOI: 10.1371/journal.pone.0012517
Molecular biomarker analyses using circulating tumor cells
Abstract
Background: Evaluation of cancer biomarkers from blood could significantly enable biomarker assessment by providing a relatively non-invasive source of representative tumor material. Circulating Tumor Cells (CTCs) isolated from blood of metastatic cancer patients hold significant promise in this regard.
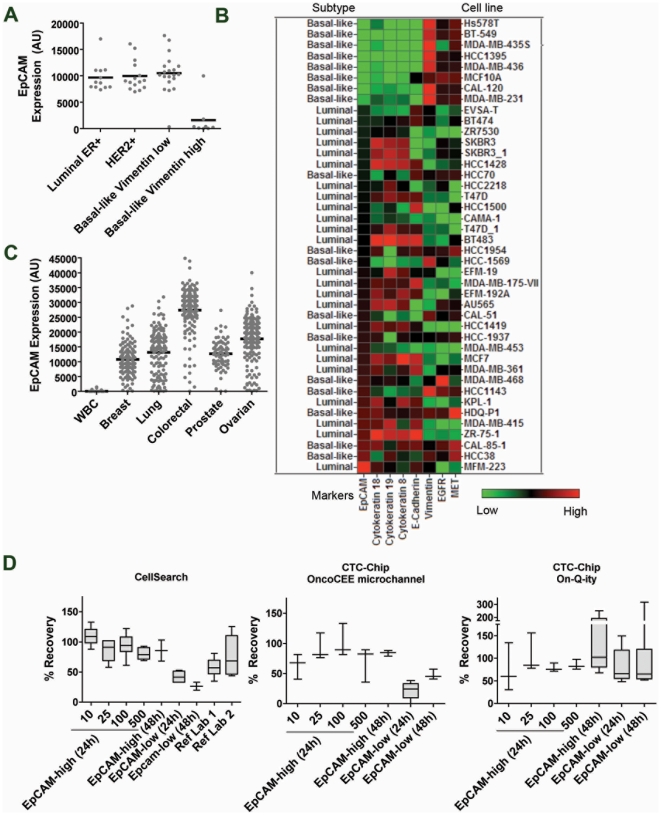
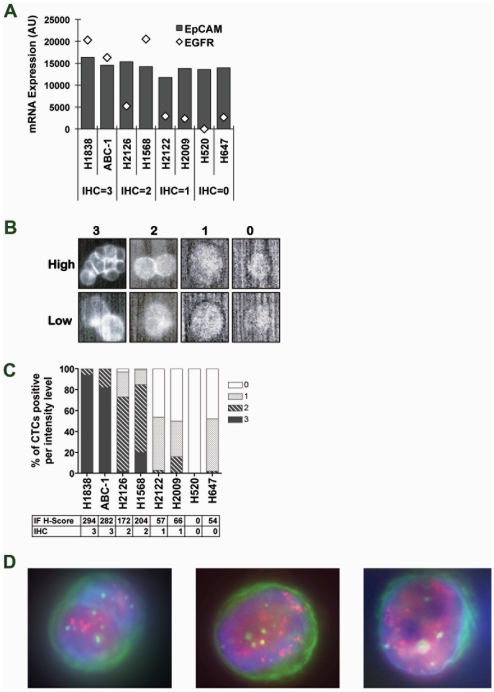
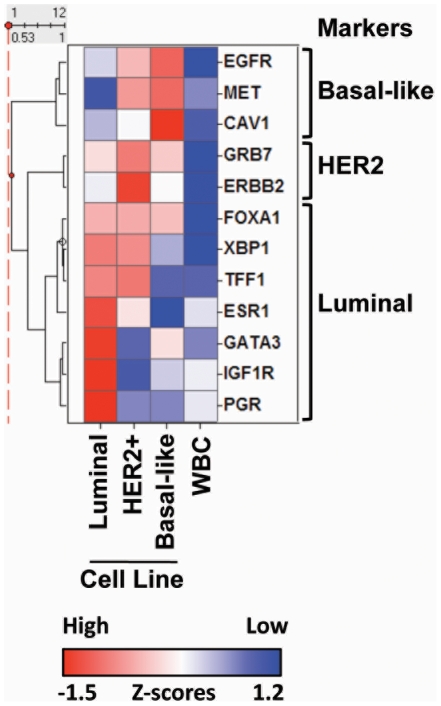
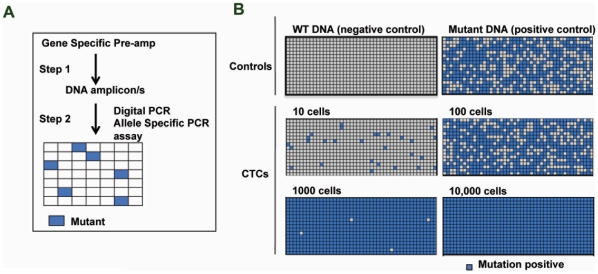
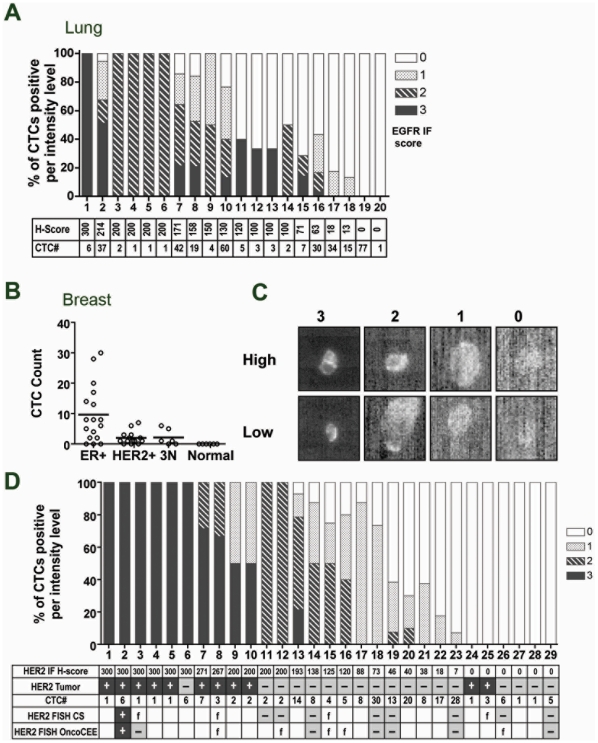
Methodology/principal findings: Using spiked tumor-cells we evaluated CTC capture on different CTC technology platforms, including CellSearch and two biochip platforms, and used the isolated CTCs to develop and optimize assays for molecular characterization of CTCs. We report similar performance for the various platforms tested in capturing CTCs, and find that capture efficiency is dependent on the level of EpCAM expression. We demonstrate that captured CTCs are amenable to biomarker analyses such as HER2 status, qRT-PCR for breast cancer subtype markers, KRAS mutation detection, and EGFR staining by immunofluorescence (IF). We quantify cell surface expression of EGFR in metastatic lung cancer patient samples. In addition, we determined HER2 status by IF and FISH in CTCs from metastatic breast cancer patients. In the majority of patients (89%) we found concordance with HER2 status from patient tumor tissue, though in a subset of patients (11%), HER2 status in CTCs differed from that observed in the primary tumor. Surprisingly, we found CTC counts to be higher in ER+ patients in comparison to HER2+ and triple negative patients, which could be explained by low EpCAM expression and a more mesenchymal phenotype of tumors belonging to the basal-like molecular subtype of breast cancer.
Conclusions/significance: Our data suggests that molecular characterization from captured CTCs is possible and can potentially provide real-time information on biomarker status. In this regard, CTCs hold significant promise as a source of tumor material to facilitate clinical biomarker evaluation. However, limitations exist from a purely EpCAM based capture system and addition of antibodies to mesenchymal markers could further improve CTC capture efficiency to enable routine biomarker analysis from CTCs.
Conflict of interest statement
Figures
References
-
- Lackner MR. Prospects for personalized medicine with inhibitors targeting the RAS and PI3K pathways. Expert Rev Mol Diagn. 2010;10:75–87. - PubMed
-
- Tan DS, Thomas GV, Garrett MD, Banerji U, de Bono JS, et al. Biomarker-driven early clinical trials in oncology: a paradigm shift in drug development. Cancer J. 2009;15:406–420. - PubMed
-
- Carden CP, Sarker D, de Bono JS. Can molecular biomarker-based patient selection in Phase I trials accelerate anticancer drug development? Drug Discov Today 2009 - PubMed
-
- Bardelli A, Siena S. Molecular Mechanisms of Resistant to Cetuximab and Panitumumab in Colorectal Cancer. Journal of Clinical Oncology 2010 - PubMed
-
- Vogel CL, Cobleigh MA, Tripathy D, Gutheil JC, Harris LN, et al. Efficacy and safety of trastuzumab as a single agent in first-line treatment of HER2-overexpressing metastatic breast cancer. J Clin Oncol. 2002;20:719–726. - PubMed
Publication types
MeSH terms
Substances
LinkOut - more resources
Full Text Sources
Other Literature Sources
Medical
Research Materials
Miscellaneous
