. 2011 Oct;13(5):886-97.
doi: 10.1007/s11307-010-0417-7.

Saposin C coupled lipid nanovesicles enable cancer-selective optical and magnetic resonance imaging

Affiliations

Saposin C coupled lipid nanovesicles enable cancer-selective optical and magnetic resonance imaging

Vinod Kaimal et al. Mol Imaging Biol. 2011 Oct.

Abstract

Purpose: Nanovesicles composed of the phospholipid dioleylphosphatidylserine (DOPS) and a fusogenic protein, saposin C (SapC), selectively target and induce apoptotic cell death in a variety of human cancer cells in vitro and in vivo. We tested whether such tumor-homing nanovesicles are capable of delivering fluorescent probes and magnetic resonance (MR) contrast agents to cancerous tissue to aid in earlier detection and improve visualization.

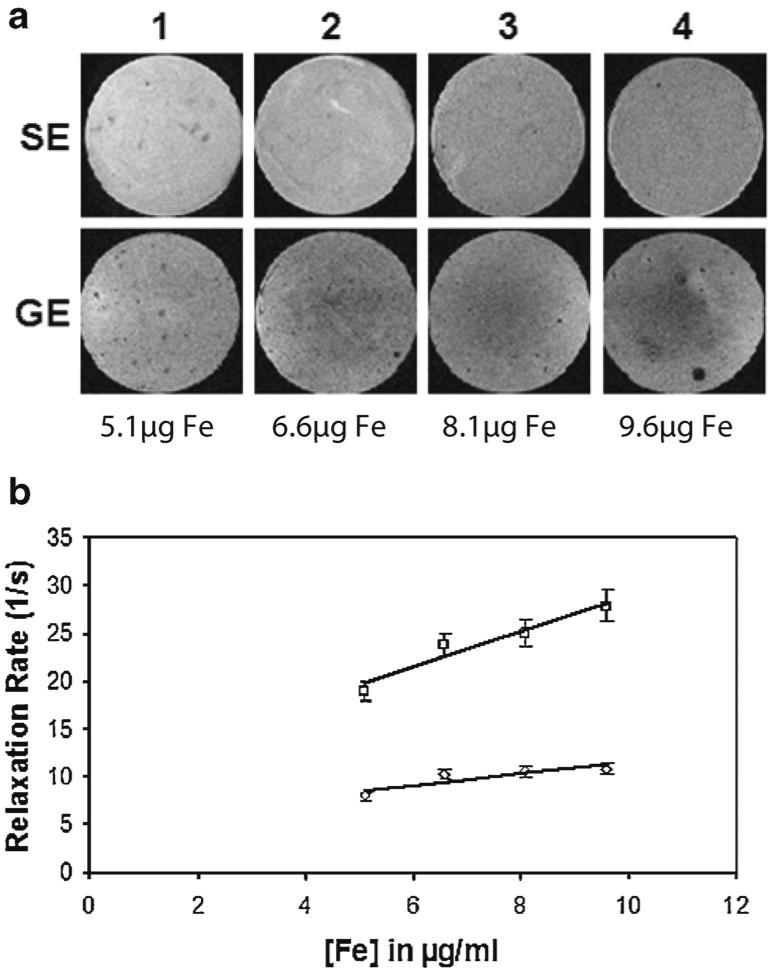
Procedures: SapC-DOPS nanovesicles labeled with either a far-red fluorescent probe (CellVue® Maroon, CVM) or conjugated with a dextran coated MR contrast agent, ultrasmall superparamagnetic iron oxide (USPIO), were systemically administrated into xenografts for tumor detection using optical and MR imaging systems.

Results: SapC-DOPS nanovesicles were effectively detected in vivo in tumor-bearing animals using both optical and MR imaging techniques, thereby demonstrating the cancer-selective properties of these nanovesicles.

Conclusions: SapC-DOPS nanovesicles offer promise as a new and robust theranostic agent for broad cancer-selective detection, visualization, and potential therapy.


Figures

Fig. 1
Fig. 1
Functional organization of Saposin C: human Saposin C (SapC) is an 80-aa hydrophobic protein required for the activation of the enzyme glucocerebrosidase. SapC binds to membranes via two membrane-binding domains (MBD), while the fusogenic domain (FD, highlighted) is necessary for membrane fusion. SapC has an N-glycosylation site (NKT), six cysteines, and an enzyme activation domain (QEVV...SIL).
Fig. 2
Fig. 2
Electron micrograph and size distribution of SapC–DOPS and SapC–DOPS–IO nanovesicles. a Freeze-fracture electron micrograph of SapC–DOPS nanovesicles. The bars represent 100 nm, and the shadow direction is running from bottom to top. b Transmission electron microscope images of vesicles loaded with USPIO contrast particles. c and d N4 plus particle size analysis. Sample containing free USPIO particles and vesicles (c). The two peaks indicate the relative numbers of USPIO and vesicles on an arbitrary scale and the location of the peaks represent the mean diameter of USPIO and vesicles. d Sample passed through a Con-A Sepharose column and passed through Liposofast® Extruder. Free USPIO is eliminated and a monodisperse nanovesicle solution is obtained. Mean vesicle diameter is approximately 230 nm.
Fig. 3
Fig. 3
MRI of SapC–DOPS–IO in human neuroblastoma (CHLA-20) cells. a MR images of cells fixed in agarose. T2* weighted 3D-FLASH imaging on 7 T Bruker (TE=30 ms/TR=50 ms/FA=10°/16 averages, 100 μm isotropic resolution). b R2 relaxation rates of labeled cells fixed in agarose. c (R2*) relaxation rates of labeled cells fixed in agarose. d (R2 and R2*) values of the vials correlated with the actual iron concentrations obtained from ICP-AES measurements of identical samples. Note: Error bars along the x-axis are of the order of 0.001 μg and therefore not visible at this scale.
Fig. 4
Fig. 4
Uptake analysis of SapC–DOPS–IO by MRI in human neuroblastoma (CHLA-20) cells. a Image strip showing spin echo (top row) and gradient echo (bottom row) images of vials containing iron oxide loaded cells fixed in agarose. Vials in columns 1, 2, 3, and 4 contain cells that were incubated with 5.1, 6.6, 8.1, and 9.6 μg of Fe, respectively, for 12 h. b Plot of R2 and R2* relaxation rates of cells fixed in agarose plotted against initial iron concentration in growth medium. The mean values and standard deviation over three samples are shown.
Fig. 5
Fig. 5
Tumor-selective imaging of fluorescent labeled SapC–DOPS nanovesicles in animals. a Biodistribution of intravenously administered CVM-labeled SapC–DOPS to mice bearing pancreatic xenografts indicates tumor-targeting potential. Athymic nude mice bearing pancreatic xenografts (circled 1 and 2) and a nontumor-bearing animal (3) were treated with coupled CVM-labeled SapC–DOPS nanovesicles. Imaging time points were 0, 2, 5, 24, 52, and 100 h after injection. b Fluorescence and photo mages of neuroblastoma xenografts treated with (from left to right): coupled CVM-labeled SapC–DOPS (circled 1), SapC and CVM-labeled DOPS (circled 2), and CVM-labeled DOPS alone (circled 3). c Fluorescence and photo images of CVM-labeled SapC–DOPS in murine rhabdomyosarcoma (MR366) allografts. Fluorescence filters: Ex=640 nm, Em=700 nm. SapC=4.2 mg/kg, DOPS=2 mg/kg, CVM=6 μmol. Images were acquired 24 h after injection.
Fig. 6
Fig. 6
In vivo MR imaging of SapC–DOPS–IO in mice with xenografts. ac Human neuroblastoma (CHLA-20) tumors. a Image strip shows T2* weighted FLASH image of tumor before and after injection of contrast agent (TE=5 ms/TR=20 ms/FA=10°), 16 averages; resolution: 100 μm isotropic. b Normalized tumor signal intensity (dimensionless) is plotted at the time points of image acquisition, obtained over a 3D slab. The tumor signal intensity is normalized against an ROI chosen just below the tumor tissue at each time point. c ICP-AES data representing iron concentration in excised tumor of mouse treated with SapC shows nearly 5-fold iron concentration when compared with the iron in an untreated mouse. d Human pancreatic (MiaPaCa-2) tumor. Representative T2 map of tumor was imaged before and after injections (4 h) of SapC–DOPS–IO. An average change in T2 of approximately 29 ms was seen, from 91.4±11.6 to 62.8±8.6 ms in a manually drawn ROI of approximately the same slice of tumor (n=5).

References

    1. Hoffman RM, Yang M. Subcellular imaging in the live mouse. Nature Protoc. 2006;1:775–782. - PubMed
    1. Marx V. Molecular imaging: companies set out to sharpen the in vivo perspective with new machines and novel contrast agents. Chem Eng News. 2005;83:25–34.
    1. Fernandes RS, Kirszberg C, Rumjanek VM, et al. On the molecular mechanisms for the highly procoagulant pattern of C6 glioma cells. J Thromb Haemost. 2006;4:1546–52. - PubMed
    1. Ran S, Downes A, Thorpe PE. Increased exposure of anionic phospholipids on the surface of tumor blood vessels. Cancer Res. 2002;62:6132–40. - PubMed
    1. Ran S, Thorpe PE. Phosphatidylserine is a marker of tumor vasculature and a potential target for cancer imaging and therapy. Int J Radiat Oncol Biol Phys. 2002;54:1479–84. - PubMed

Publication types