. 2010 Sep 14:10:490.
doi: 10.1186/1471-2407-10-490.

Transcriptional profiling of ErbB signalling in mammary luminal epithelial cells--interplay of ErbB and IGF1 signalling through IGFBP3 regulation

Affiliations

Transcriptional profiling of ErbB signalling in mammary luminal epithelial cells--interplay of ErbB and IGF1 signalling through IGFBP3 regulation

Jenny Worthington et al. BMC Cancer. .

Abstract

Background: Members of the ErbB family of growth factor receptors are intricately linked with epithelial cell biology, development and tumourigenesis; however, the mechanisms involved in their downstream signalling are poorly understood. Indeed, it is unclear how signal specificity is achieved and the relative contribution each receptor has to specific gene expression.

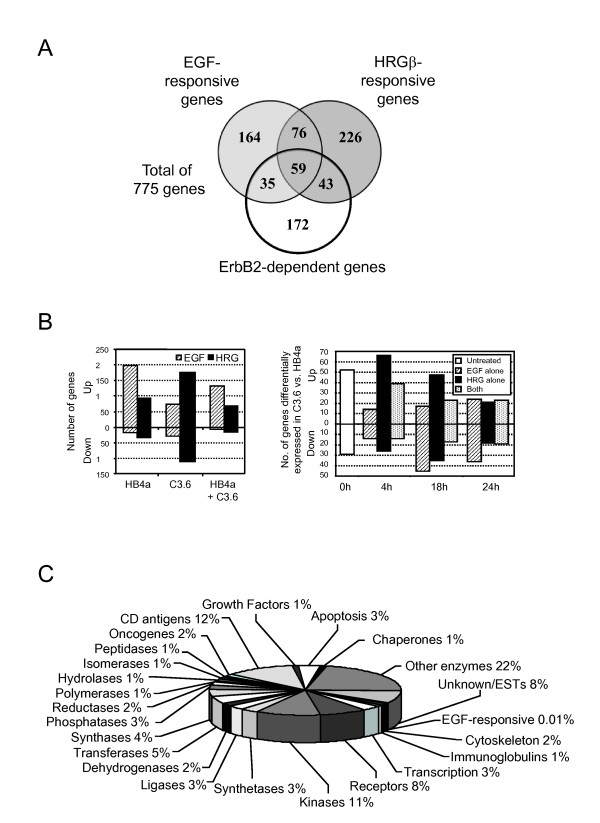
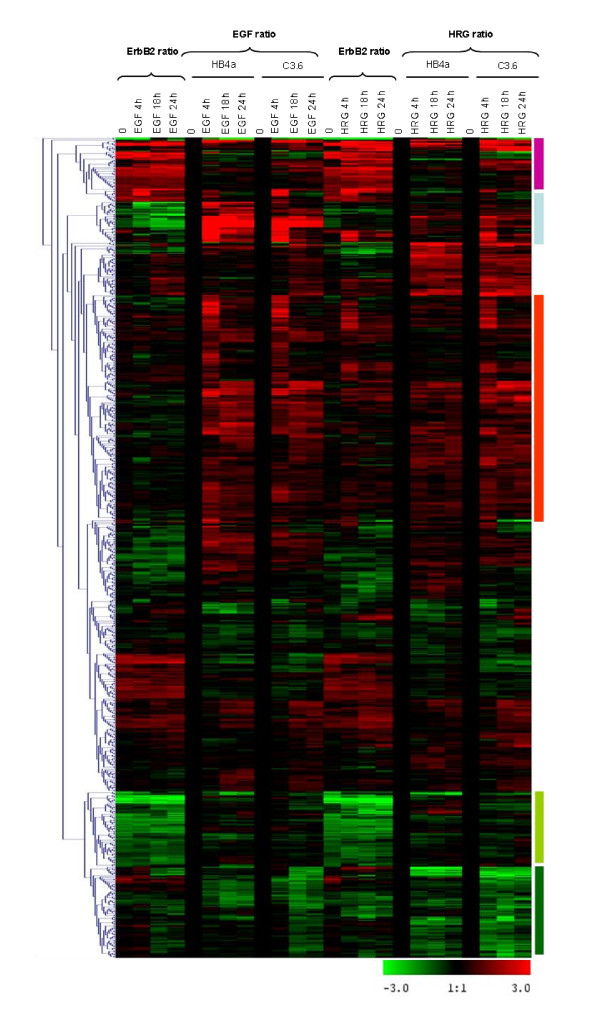
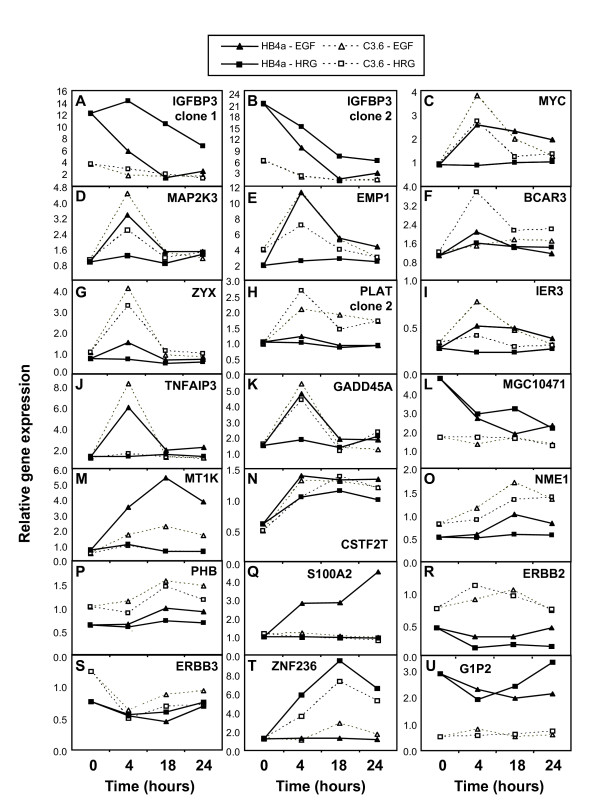
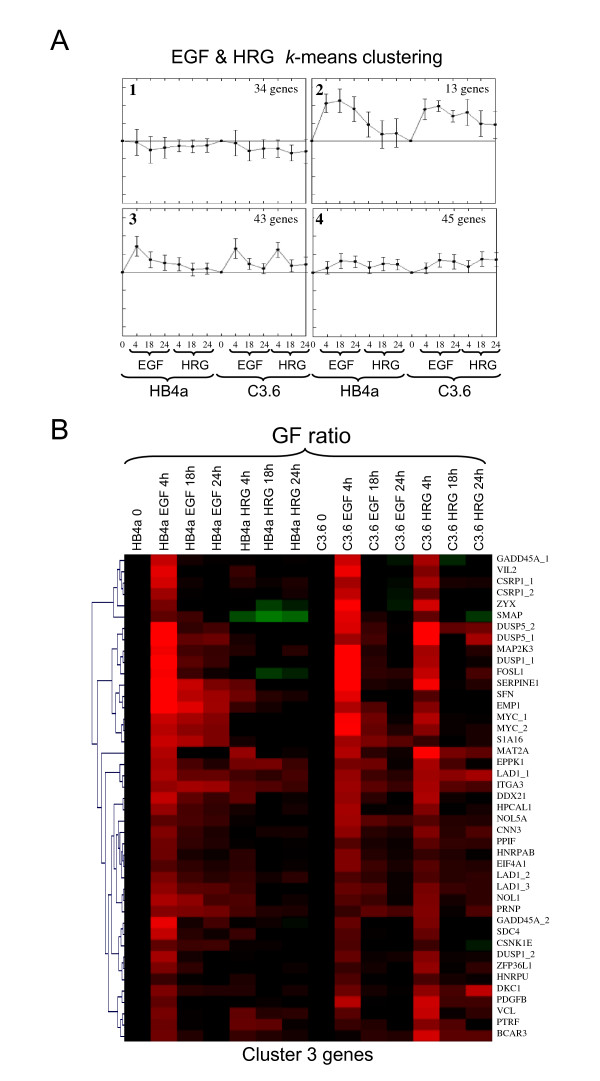
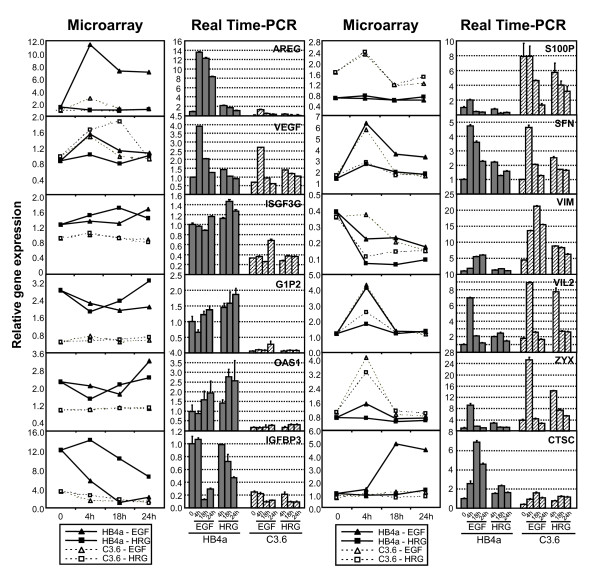
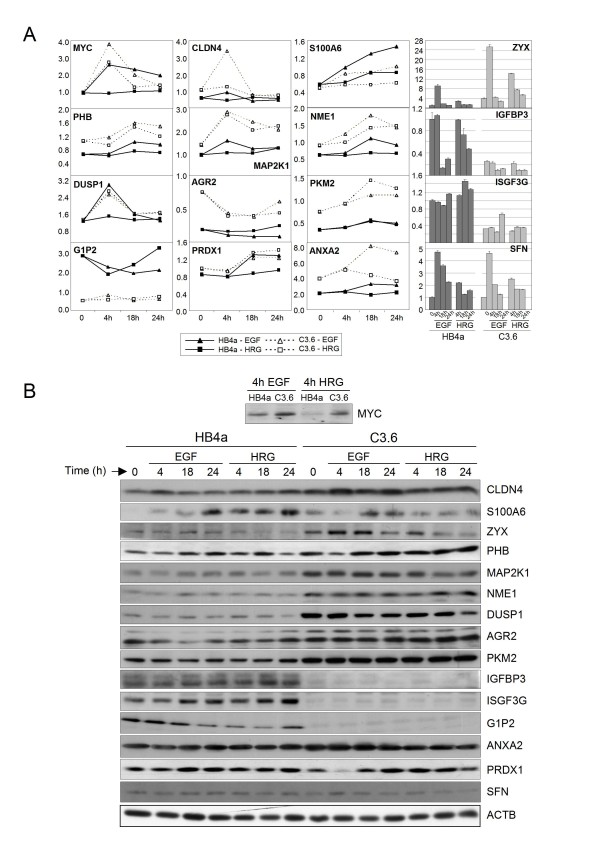
Methods: Gene expression profiling of a human mammary luminal epithelial cell model of ErbB2-overexpression was carried out using cDNA microarrays with a common RNA reference approach to examine long-term overlapping and differential responses to EGF and heregulin beta1 treatment in the context of ErbB2 overexpression. Altered gene expression was validated using quantitative real time PCR and/or immunoblotting. One gene of interest was targeted for further characterisation, where the effects of siRNA-mediated silencing on IGF1-dependent signalling and cellular phenotype were examined and compared to the effects of loss of ErbB2 expression.

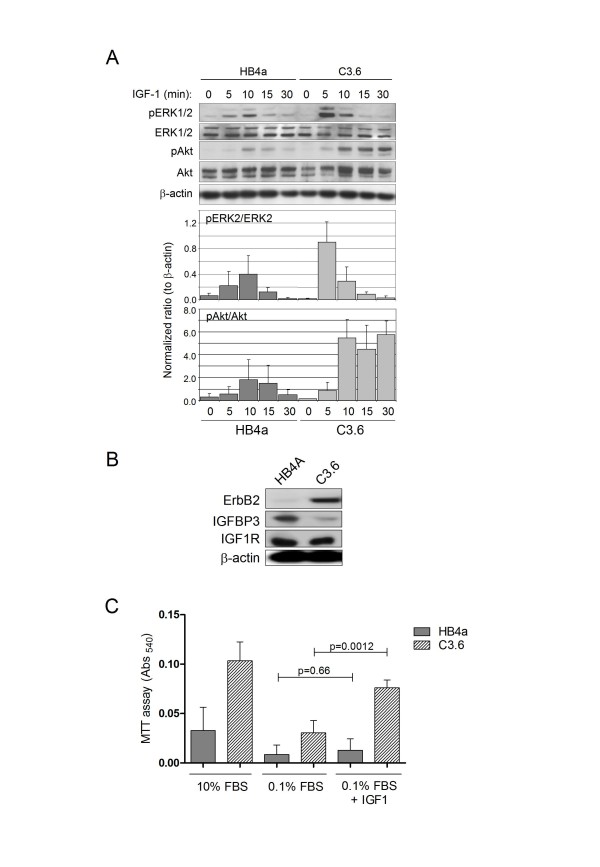
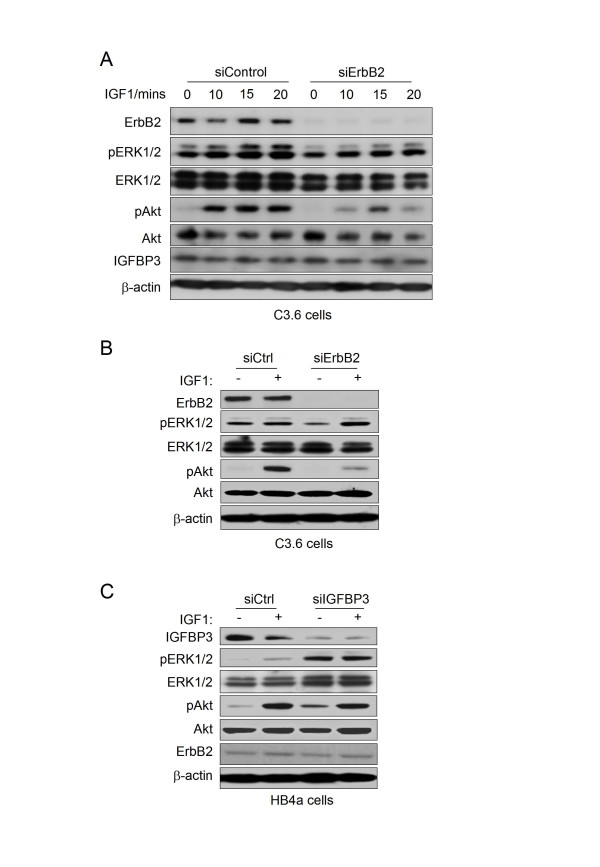
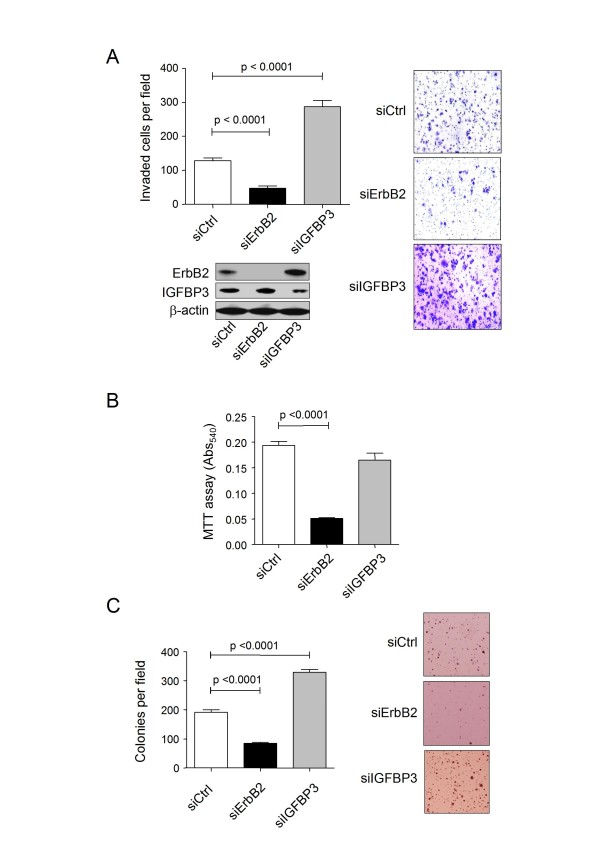
Results: 775 genes were differentially expressed and clustered in terms of their growth factor responsiveness. As well as identifying uncharacterized genes as novel targets of ErbB2-dependent signalling, ErbB2 overexpression augmented the induction of multiple genes involved in proliferation (e.g. MYC, MAP2K1, MAP2K3), autocrine growth factor signalling (VEGF, PDGF) and adhesion/cytoskeletal regulation (ZYX, THBS1, VCL, CNN3, ITGA2, ITGA3, NEDD9, TAGLN), linking them to the hyper-poliferative and altered adhesive phenotype of the ErbB2-overexpressing cells. We also report ErbB2-dependent down-regulation of multiple interferon-stimulated genes that may permit ErbB2-overexpressing cells to resist the anti-proliferative action of interferons. Finally, IGFBP3 was unique in its pattern of regulation and we further investigated a possible role for IGFBP3 down-regulation in ErbB2-dependent transformation through suppressed IGF1 signalling. We show that IGF1-dependent signalling and proliferation were enhanced in ErbB2-overexpressing cells, whilst loss of ErbB2 expression by siRNA silencing reduced IGF1 signalling. Furthermore, IGFBP3 knockdown resulted in basal ERK and Akt activation in luminal epithelial cells and increased invasiveness and anchorage-independent colony formation in SKBR3 cells.

Conclusions: These data show IGFBP3 as a negative regulator of transformation and that its down-regulation enhances IGF1-dependent signalling. They also show that ErbB2 can up-regulate IGF1-dependent signalling, possibly via the regulated expression of IGFBP3.


Figures

Figure 1
Figure 1
Numbers and functions of differentially expressed genes. A. Venn diagram showing the distribution of the 775 genes found to be significantly differentially expressed and their co-regulation by EGF, HRG and ErbB2. B. Distribution of up- or down-regulated genes by cell line and growth factor (left) and in C3.6 vs. HB4a over time (right). C. Distribution of functional classes of differentially regulated genes based on GO terms for molecular function.
Figure 2
Figure 2
Hierarchical clustering of 775 differentially expressed genes. Ratios of normalized values were used to show relative gene expression in two ways: (i) the EGF or HRG ratio (T*/T0) representing relative gene expression at each timepoint in relation to the untreated control, measuring the response to each ligand in HB4a and C3.6 cells separately, and (ii) the ErbB2 ratio (C3.6/HB4a) representing relative gene expression in C3.6 vs. HB4a at each time point, identifying genes whose expression are affected by ErbB2. Ratios were log2 transformed and loaded into TIGR MeV software v2.2 (Institute for Genomic Research) and unsupervised, average-linkage hierarchical clustering performed. Clusters indicated by light green and pink bands (on right) show genes whose expressions were altered by ErbB2 overexpression, but were similarly up- or down-regulated by EGF and HRG; the light blue cluster shows genes down-regulated by ErbB2, but up-regulated by EGF; the dark green cluster shows genes that were down-regulated by both growth factors and the red cluster shows genes that were transiently-induced in all treatments except in HRG-treated HB4a cells.
Figure 3
Figure 3
Examples of growth factor and ErbB2-dependent differential gene expression. Plots of relative gene expression (averaged (n = 4) normalised fluorescence intensity) versus time are shown for 20 genes. Data for both microarray clones are shown for IGFBP3. Genes showing a change in expression following growth factor treatment and significantly different between the cell lines were: IGFBP3_1 (1.18-fold increase in HB4a versus 1.3-fold decrease in C3.6 with EGF (0 to 4 hr); MYC (1.05-fold decrease in HB4a versus 3.09-fold increase in C3.6 with HRG (0 to 4 hr); MAP2K3 (1.39-fold increase in HB4a versus 2.49-fold increase in C3.6 with HRG (0 to 4 hr); BCAR3 (1.52-fold increase in HB4a versus 3.18-fold increase in C3.6 with HRG (0 to 4 hr); ZYX (1.05-fold decrease in HB4a versus 3.17-fold increase in C3.6 with HRG (0 to 4 hr); PLAT2 (1.18-fold increase in HB4a versus 2.13-fold increase in C3.6 with EGF (0 to 4 hr) and 1.01-fold increase in HB4a versus 2.76-fold increase in C3.6 with HRG (0 to 4 hr); TNFAIP3 (4.98-fold increase in HB4a versus 7.74-fold increase in C3.6 with EGF (0 to 4 hr); GADD45A (1.26-fold increase in HB4a versus 2.82-fold increase in C3.6 with HRG (0 to 4 hr); S100A2 (2.88-fold increase in HB4a versus 1.02-fold increase in C3.6 with EGF (0 to 4 hr); ERBB2 (3.13-fold decrease in HB4a versus 1.48-fold increase in C3.6 with HRG (0 to 4 hr); ZNF236 (4.85-fold increase in HB4a versus 2.83-fold increase in C3.6 with HRG (0 to 4 hr).
Figure 4
Figure 4
K-means clustering and hierarchical clustering of EGF and HRG-responsive genes. A. For k-means clustering in TIGR MeV software v2.2 (Institute for Genomic Research), growth factor-responsive genes from SAM were grouped separately and sub-divided into a user-defined number (k = 4) of groups. Plots show the four groups as average expression patterns for genes regulated by both growth factors. B. Group 3 genes which were transiently induced by both growth factors except by HRG in HB4a cells were subjected to hierarchical clustering as above.
Figure 5
Figure 5
Comparison of microarray and real time RT-PCR data. Real time RT-PCR was performed on 12 target genes using Applied Biosystems' Assay-on-Demand and relative gene expression calculated using the ΔCt or standard curve method (see Methods for details).
Figure 6
Figure 6
Immunoblot validation of differentially expressed genes. A. Relative gene expression for 16 selected genes by microarray or real time RT-PCR analysis. B. Protein expression for these gene products by immunoblotting. Representative blots from 3-5 independent experiments are shown, including a beta-actin loading control. Myc protein expression was only examined at the 4 hr timepoint and was not detected at other time-points. Relative quantification of immunoblotting data is shown in Additional file 6.
Figure 7
Figure 7
ErbB2-enhances IGF1 signalling and proliferation in the HMLEC system. A. Cells were starved of serum for 48 hrs and then stimulated with 25 ng/mL IGF1 for the indicated times. Activation of ERK1/2 and Akt was assessed by immunoblotting with phospho-specific antibodies and protein levels checked by re-probing membranes with non-phospho-specific and beta-actin antibodies. Blotting data was quantified by densitometry. Intensities for each band were normalized to the actin band in that lane and the ratios pAkt/Akt and pERK2/ERK2 calculated. Normalized ratios were then averaged from 3 independent blots and plotted using standard deviation as the error. B. Levels of ErbB2, IGFBP3 and IGF1R in HB4a and C3.6 cells were assessed by immunoblotting. C. MTT proliferation assays were carried out on HMLECs in media supplemented with 10% FBS, 0.1% FBS and 0.1% FBS plus 25 ng/mL IGF1 over a period of 48 hrs.
Figure 8
Figure 8
Effect of siRNA-mediated knockdown of ErbB2 expression on IGF1-stimulated signalling. A. Control siRNA and siErbB2-transfected C3.6 cells were serum starved for 48 hrs and then stimulated with 25 ng/mL IGF1 for the indicated times. Activation of ERK1/2 and Akt was assessed by immunoblotting with phospho-specific antibodies and protein levels checked by re-probing membranes with non-phospho-specific, ErbB2, IGFBP3 and beta-actin antibodies. B. Control siRNA and siErbB2-transfected C3.6 cells were serum starved for 48 hrs and then stimulated with 25 ng/mL IGF1 for 20 min (+) or left unstimulated (-). Lysates were immunoblotted as in A. C. Control siRNA and siIGFBP3-transfected HB4a cells were serum starved for 48 hrs and then stimulated with 25 ng/mL IGF1 for 20 min (+) or left unstimulated (-). Lysates were immunoblotted as in A.
Figure 9
Figure 9
Effect of siRNA-mediated knockdown of ErbB2 and IGFBP3 expression on invasiveness, proliferation and anchorage independent colony formation in SKBR3 cells. A. Control siRNA, siErbB2- and siIGFBP3-transfected SKBR3 cells were subjected to a Matrigel-based invasion assay as described in the Methods section. The graph shows the number of invaded cells per field for each condition. Images of stained invaded cells are shown on the right. Knockdowns were confirmed by immunoblotting. B. An MTT-based proliferation assay was carried out on control siRNA, siErbB2- and siIGFBP3-transfected SKBR3 cells in complete media over 48 hrs. C. Control siRNA, siErbB2- and siIGFBP3-transfected SKBR3 cells were assayed for anchorage-independent growth using a soft agar colony forming assay (see Methods section). The graph shows the average number of colonies per field, whilst the images show representative microscopy fields.

Similar articles

Cited by

References

    1. Yarden Y, Sliwkowski MX. Untangling the ErbB signalling network. Nat Rev Mol Cell Biol. 2001;2(2):127–137. doi: 10.1038/35052073. - DOI - PubMed
    1. Alroy I, Yarden Y. The ErbB signaling network in embryogenesis and oncogenesis: signal diversification through combinatorial ligand-receptor interactions. FEBS Lett. 1997;410(1):83–86. doi: 10.1016/S0014-5793(97)00412-2. - DOI - PubMed
    1. Graus-Porta DBR, Daly JM, Hynes NE. ErbB-2, the preferred heterodimerization partner of all ErbB receptors, is a mediator of lateral signaling. EMBO J. 1997;16(7):1647–1655. doi: 10.1093/emboj/16.7.1647. - DOI - PMC - PubMed
    1. Karunagaran D, Tzahar E, Beerli RR, Chen X, Graus-Porta D, Ratzkin BJ, Seger R, Hynes NE, Yarden Y. ErbB-2 is a common auxiliary subunit of NDF and EGF receptors: implications for breast cancer. Embo J. 1996;15(2):254–264. - PMC - PubMed
    1. Beerli RR, Graus-Porta D, Woods-Cook K, Chen X, Yarden Y, Hynes NE. Neu differentiation factor activation of ErbB-3 and ErbB-4 is cell specific and displays a differential requirement for ErbB-2. Mol Cell Biol. 1995;15(12):6496–6505. - PMC - PubMed

Publication types

MeSH terms