

Correlating pharmaceutical data with a national health survey as a proxy for estimating rural population health
- PMID: 20840767
- PMCID: PMC3161378
- DOI: 10.1186/1478-7954-8-25
Correlating pharmaceutical data with a national health survey as a proxy for estimating rural population health
Abstract
Background: Chronic disease accounts for nearly three-quarters of US deaths, yet prevalence rates are not consistently reported at the state level and are not available at the sub-state level. This makes it difficult to assess trends in prevalence and impossible to measure sub-state differences. Such county-level differences could inform and direct the delivery of health services to those with the greatest need.
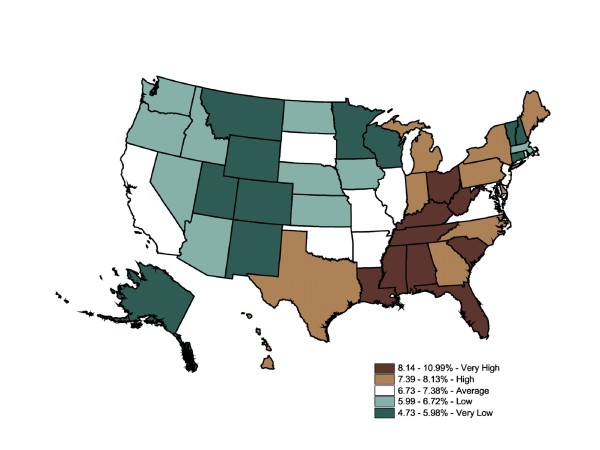
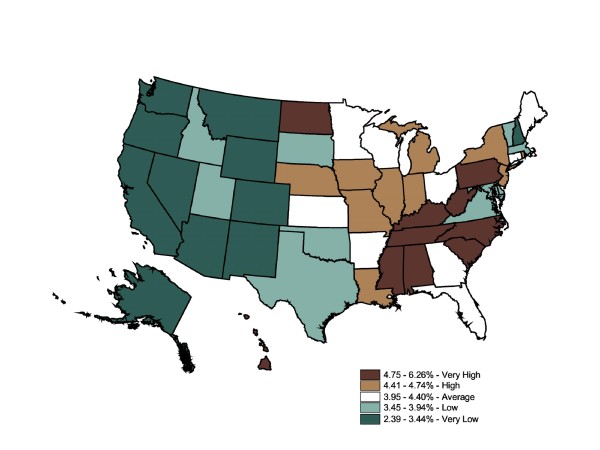
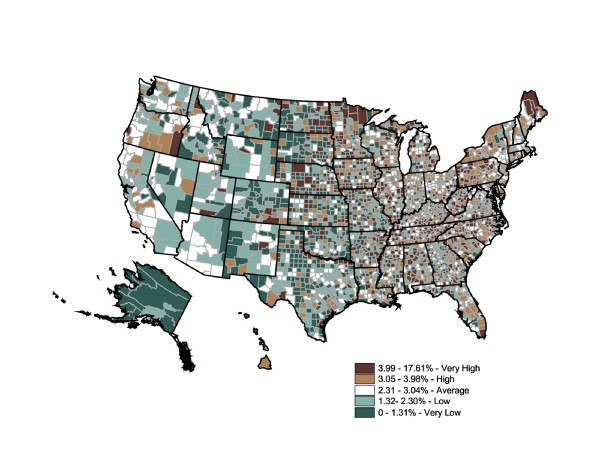
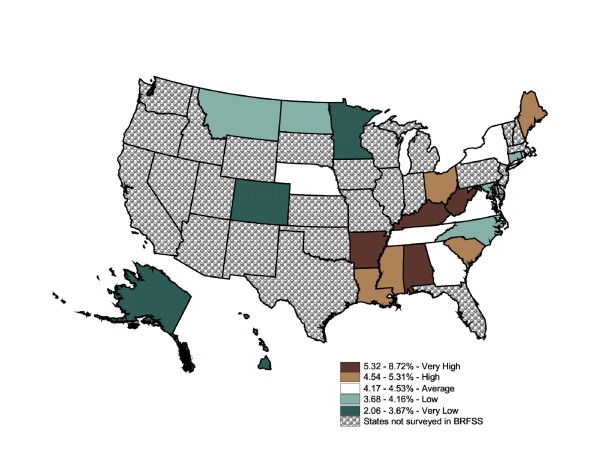
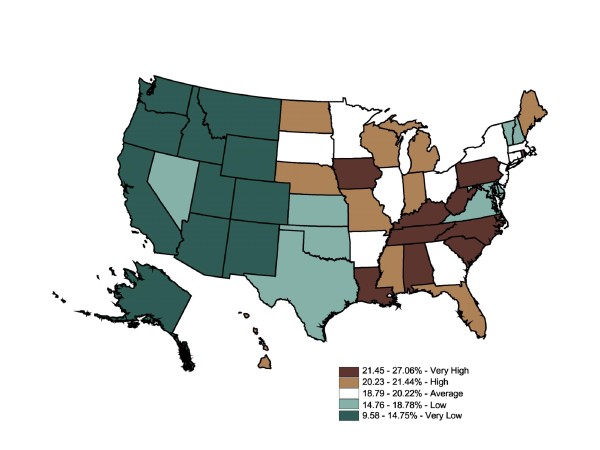
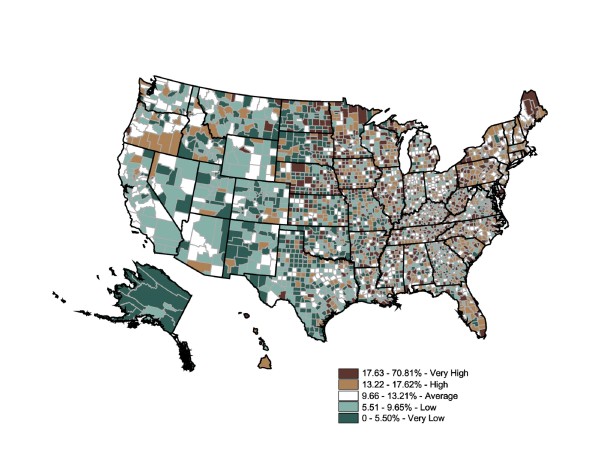
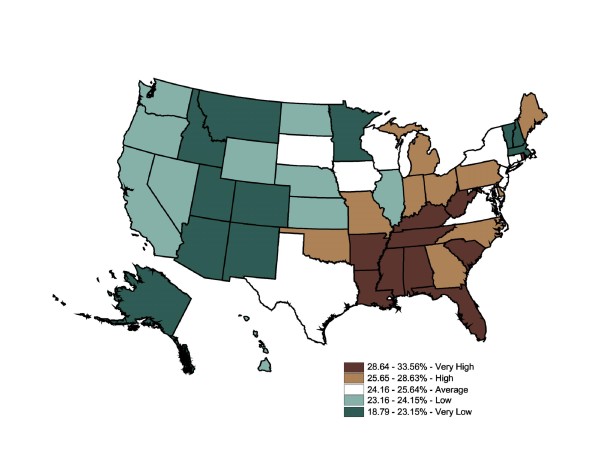
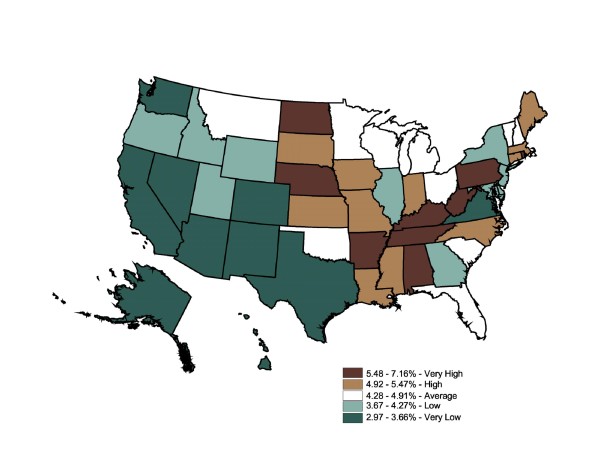
Methods: We used a database of prescription drugs filled in the US as a proxy for nationwide, county-level prevalence of three top causes of death: heart disease, stroke, and diabetes. We tested whether prescription data are statistically valid proxy measures for prevalence, using the correlation between prescriptions filled at the state level and comparable Behavioral Risk Factor Surveillance System (BRFSS) data. We further tested for statistically significant national geographic patterns.
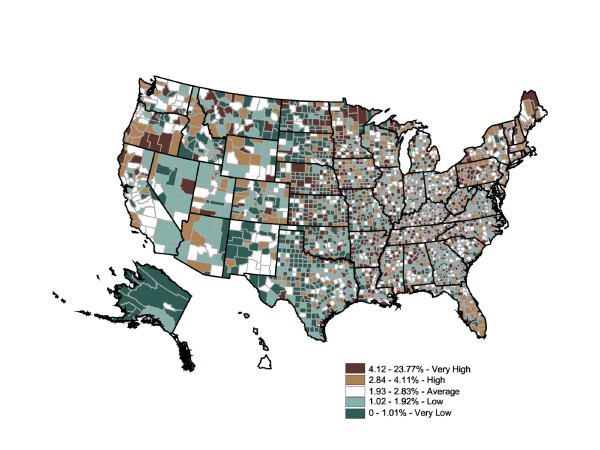
Results: Fourteen correlations were tested for years in which the BRFSS questions were asked (1999-2003), and all were statistically significant. The correlations at the state level ranged from a low of 0.41 (stroke, 1999) to a high of 0.73 (heart disease, 2003). We also mapped self-reported chronic illnesses along with prescription rates associated with those illnesses.
Conclusions: County prescription drug rates were shown to be valid measures of sub-state estimates of diagnosed prevalence and could be used to target health resources to counties in need. This methodology could be particularly helpful to rural areas whose prevalence rates cannot be estimated using national surveys. While there are no spatial statistically significant patterns nationally, there are significant variations within states that suggest unmet health needs.
Figures
References
-
- National diabetes fact sheet: general information and national estimates on diabetes in the United States 2007. GA; 2008. http://www.cdc.gov/diabetes/pubs/pdf/ndfs_2007.pdf
-
- Desai J. State-based diabetes surveillance among minority populations. Prev Chronic Dis. 2004;1(2):1. http://www.cdc.gov/pcd/issues/2004/apr/03_0030.htm - PMC - PubMed
-
- Mukhtar Q, Brody ER, Mehta P, Camponeschi J, Clark CK, Desai J, Friedrichs M, Kemple A, Krapfl H, Ralls B, Sekhobo J. An innovative approach to enhancing the surveillance capacity of state-based diabetes prevention and control programs: the diabetes indicators and data sources Internet tool (DIDIT) Prev of Chronic Dis. 2005;2(3) http://www.cdc.gov/pcd/issues/2005/jul/04_0126.htm - PMC - PubMed
-
- Centers for Disease Control and Prevention. Selected Metropolitan/Micropolitan Area Risk Trends; c2002-2007 U.S. http://apps.nccd.cdc.gov/brfss-smart/index.asp
-
- MD: Healthy People; 2010. 2000. http://www.healthypeople.gov/document/html
LinkOut - more resources
Full Text Sources
