Comparative Study
. 2010 Nov;20(11):1582-9.
doi: 10.1101/gr.105072.110. Epub 2010 Sep 14.

Overlapping codes within protein-coding sequences

Affiliations
Comparative Study

Overlapping codes within protein-coding sequences

Shalev Itzkovitz et al. Genome Res. 2010 Nov.

Abstract

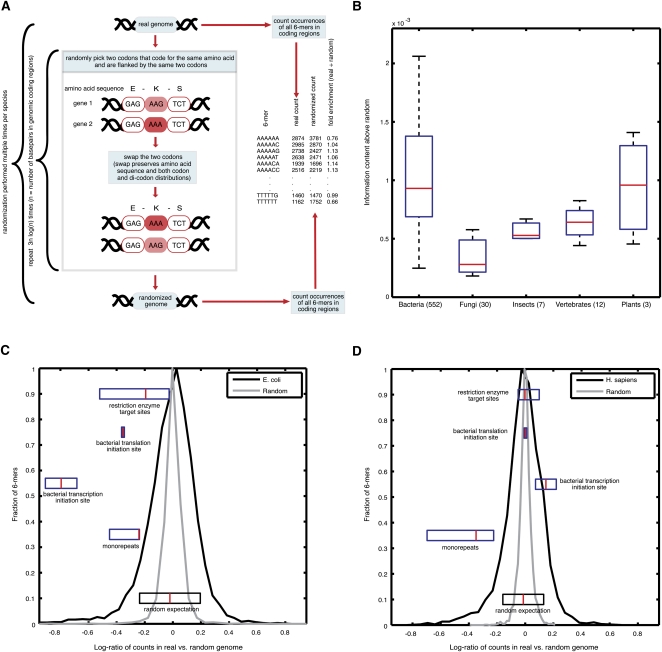
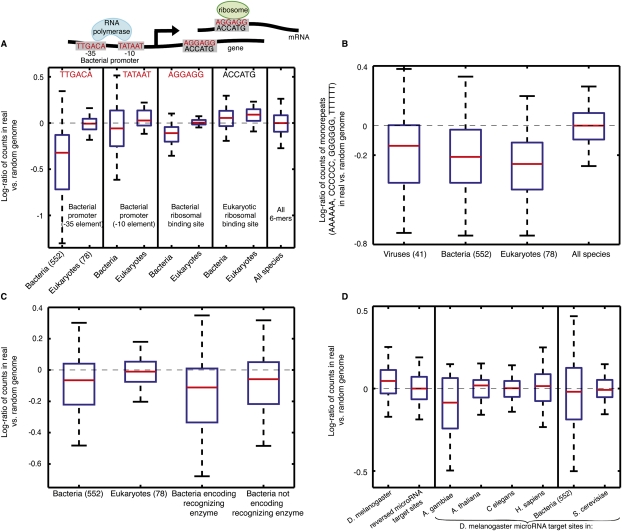
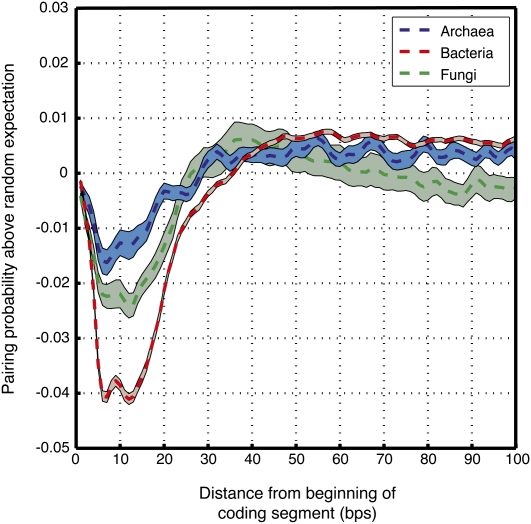
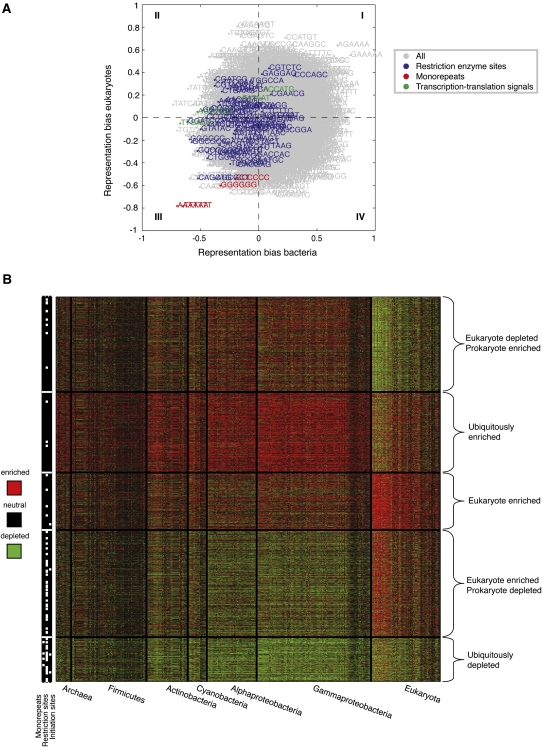
Genomes encode multiple signals, raising the question of how these different codes are organized along the linear genome sequence. Within protein-coding regions, the redundancy of the genetic code can, in principle, allow for the overlapping encoding of signals in addition to the amino acid sequence, but it is not known to what extent genomes exploit this potential and, if so, for what purpose. Here, we systematically explore whether protein-coding regions accommodate overlapping codes, by comparing the number of occurrences of each possible short sequence within the protein-coding regions of over 700 species from viruses to plants, to the same number in randomizations that preserve amino acid sequence and codon bias. We find that coding regions across all phyla encode additional information, with bacteria carrying more information than eukaryotes. The detailed signals consist of both known and potentially novel codes, including position-dependent secondary RNA structure, bacteria-specific depletion of transcription and translation initiation signals, and eukaryote-specific enrichment of microRNA target sites. Our results suggest that genomes may have evolved to encode extensive overlapping information within protein-coding regions.


Figures

Figure 1.
Figure 1.
Overview of our approach and detection of additional information encoded within protein-coding sequences. (A) Illustration of our method for identifying over- and underrepresented short sequences within coding regions. For each short sequence (here 6-mer sequences are shown), we count the number of its appearances in a given genome's coding sequences and compare that to its average number of appearances in the coding sequences of randomized genomes. The randomization swaps codons from different genomic locations only if they are both flanked by identical codons and, thus, preserves amino acid sequence, codon usage, and di-codon counts. An example of one codon swap is shown (left), and these swaps are repeated iteratively for each randomization, for each species. (B) All genomes contain additional information in their coding sequences. Shown is the Jensen-Shannon information divergence, a measure analogous to information content, between the distribution of all 6-mer sequences when counted out-of-frame in the real and randomized genomes (since our randomization preserves di-codon counts, the counts of 6-mers in-frame are equal in the real and random genomes, by construction). The Jensen-Shannon divergence is shown as a box plot for all organisms in various phyla groups. The red line denotes the median, the blue box delimits 25–75 percentiles, and the outermost bars show the minimum and maximum. The number of species from each phyla group is shown in parentheses. (C) Histograms of log-ratios of number of appearances of the out-of-frame 6-mers in E. coli (black) and out-of-frame 6-mers in randomized E. coli genomes (gray). Box plots of log-ratios for specific families of known biological signals (mononucleotide repeats, restriction enzyme target sites, and bacterial transcription and translation initiation sites) are shown in their appropriate place along the histogram. Histograms were normalized to have a maximum of 1 for ease of comparison. (D) Same as C, but for human.
Figure 2.
Figure 2.
Coding sequences display phyla-specific enrichment of known biological signals. (A) Box plot of log-ratio of number of appearances between real and randomized genomes, of sequence determinants of transcription (−35 promoter element, TTGACA; −10 promoter element, TATAAT) and translation initiation in bacteria (Shine-Dalgarno motif, AGGAGG) and of translation initiation in eukaryotes (Kozak motif, ACCATG). In each species, each of the above 6-mer sequences is counted out-of-frame in the real genome and in the randomized genome, and the log-ratio of these counts is incorporated into the box plot. The red line denotes the median, the blue box delimits 25–75 percentiles, and the outermost bars show the minimum and maximum. The number of species from each phyla group is shown in parentheses. (B) Same as A, for log-ratios of mononucleotide 6-mers across various phyla. All represents all n-mers in all species. (C) Same as A, for bacterial restriction enzyme sites. The bacteria encoding recognizing enzyme group (third box plot from left) only displays log-ratios of restriction enzyme sites in bacterial genomes that encode the enzymes that recognize those sites, whereas the bacteria not encoding recognizing enzyme group (rightmost box plot) only displays log-ratios of restriction sites in bacterial genomes that do not encode the recognizing enzymes. (D) Same as A, for log-ratios of microRNA target sites from Drosophila melanogaster. The 7-mer seed (reverse complement of nucleotides 2–8 of the microRNA) from each microRNA was taken for the log-ratio computation. The log-ratios are shown in the coding sequences of Drosophila and in several other species, as well as in 552 bacterial genomes. The distribution of the reverse sequences of the microRNA target sites is also shown as a control.
Figure 3.
Figure 3.
Coding regions tend to encode depletion of RNA secondary structure downstream of the start codon. Shown is the difference in the probability of being base-paired between the real and randomized genomes, averaged across the first 100 nt of all coding segments of archaeal (blue), bacterial (red), and fungal (green) genomes. The patches show SE of the difference. Pairing probabilities were predicted by using the Vienna package (Hofacker 2003) to fold the real and randomized genomes. Each curve was smoothed with a 3-bp moving window. Since the first codon in all coding segments has only one flanking codon, it is never swapped by our genome randomization method. Thus, by construction, the first nucleotides of the coding region are more similar between the real and randomized genomes, explaining the lower difference observed in the pairing probability of these nucleotides between the real and randomized genomes.
Figure 4.
Figure 4.
A global view of the additional information encoded within protein-coding sequences. (A) Comparison of short sequence enrichments in coding regions between bacteria and eukaryotes. For each short sequence, shown is its overall enrichment in bacteria (x-axis) and eukaryotes (y-axis), where the overall enrichment in each of the two phyla groups is taken to be the difference between the fraction of phyla species in which the sequence is enriched in the real versus randomized genome (at P < 0.05) and the fraction of species within that phyla is which it is depleted. (Red) Sequences that correspond to mononucleotide repeats; (blue) sequences that correspond to bacterial restriction enzyme sites; (green) sequences that correspond to bacterial transcription and translation initiation sites. (B) A clustering representation of the log-ratio coding region enrichment of all 6-mers across all 363 organisms whose coding regions exceed 2 Mbp. Rows, 6-mers; columns, organisms. The data were clustered using k-means clustering (k = 5) of a reduced matrix of representation bias in archaea, bacteria, and eukaryotes. White marks on the left bar indicate three specific sequence families: mononucleotide repeats (left column), restriction enzyme sites (central column), and transcription and translation initiation sites (right column). The organisms are arranged in phyla groups and are shown on the bottom. Red and green denote enrichment and depletion (P < 0.05) above that expected in randomized genomes, respectively.

Comment in

References

    1. Ackermann M, Chao L 2006. DNA sequences shaped by selection for stability. PLoS Genet 2: e22 doi: 10.1371/journal.pgen.0020022 - PMC - PubMed
    1. Andersson SG, Kurland CG 1990. Codon preferences in free-living microorganisms. Microbiol Rev 54: 198–210 - PMC - PubMed
    1. Bartel DP, Chen CZ 2004. Micromanagers of gene expression: The potentially widespread influence of metazoan microRNAs. Nat Rev Genet 5: 396–400 - PubMed
    1. Boycheva S, Chkodrov G, Ivanov I 2003. Codon pairs in the genome of Escherichia coli. Bioinformatics 19: 987–998 - PubMed
    1. Burge CB, Karlin S 1998. Finding the genes in genomic DNA. Curr Opin Struct Biol 8: 346–354 - PubMed

Publication types

MeSH terms

LinkOut - more resources