

Adipose tissue macrophages in insulin-resistant subjects are associated with collagen VI and fibrosis and demonstrate alternative activation
- PMID: 20841504
- PMCID: PMC3006260
- DOI: 10.1152/ajpendo.00329.2010
Adipose tissue macrophages in insulin-resistant subjects are associated with collagen VI and fibrosis and demonstrate alternative activation
Abstract
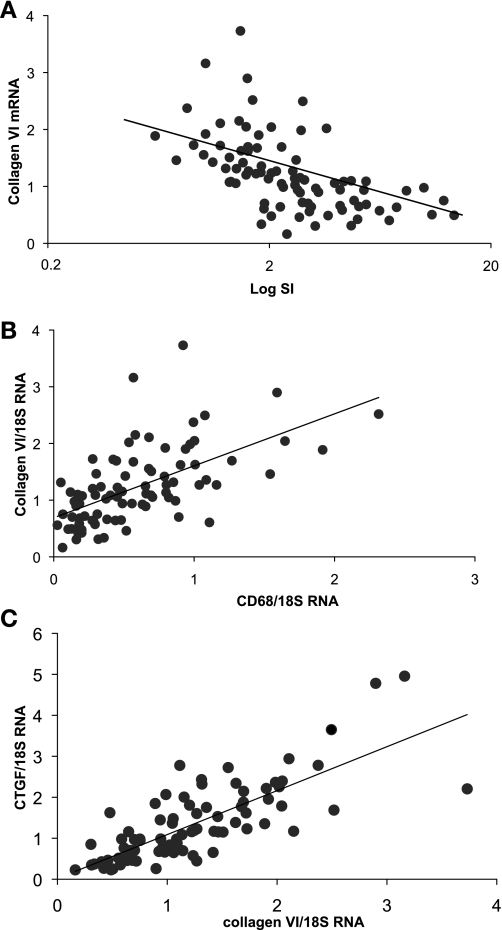
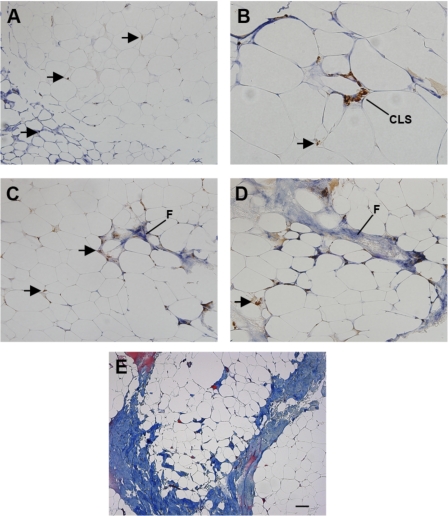
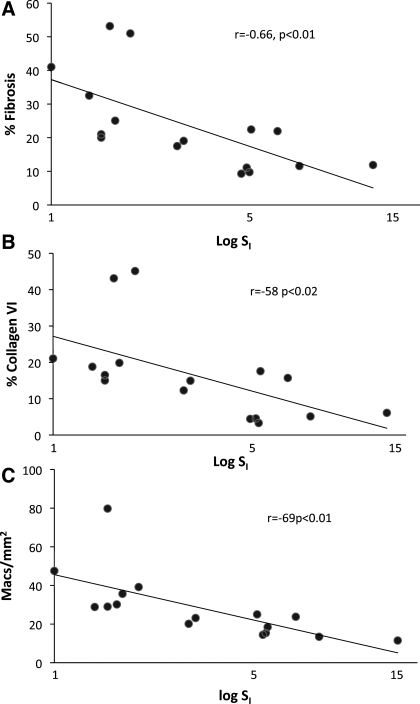
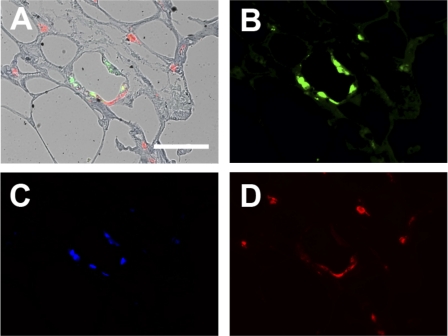
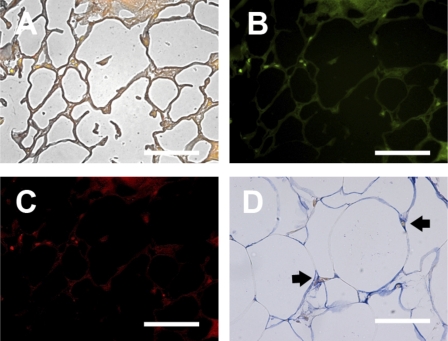
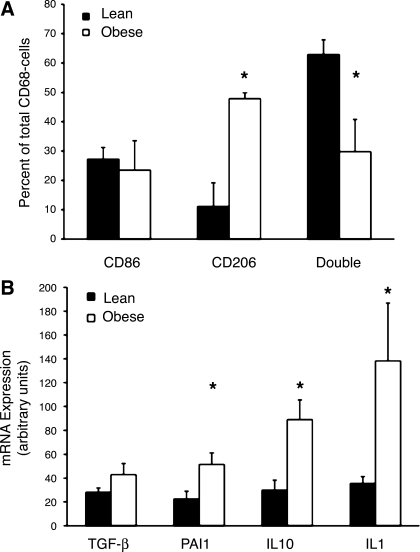
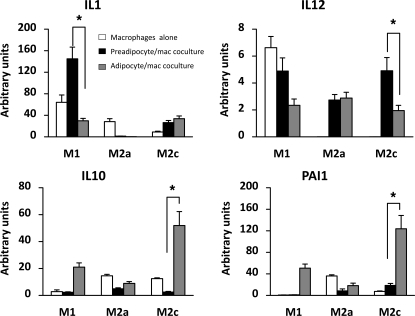
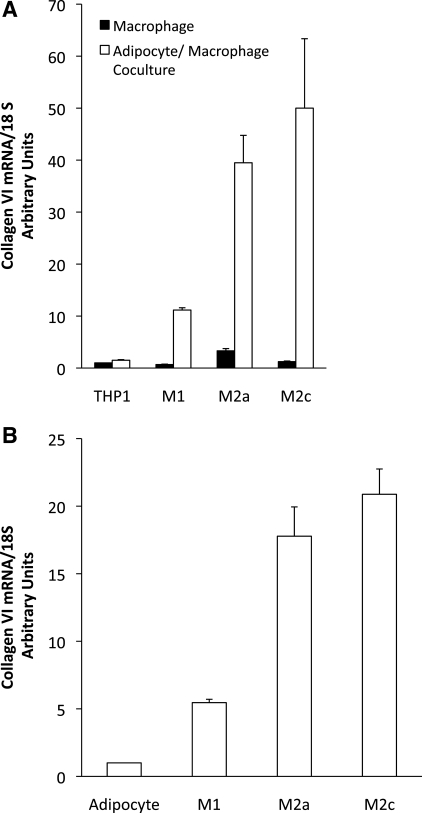
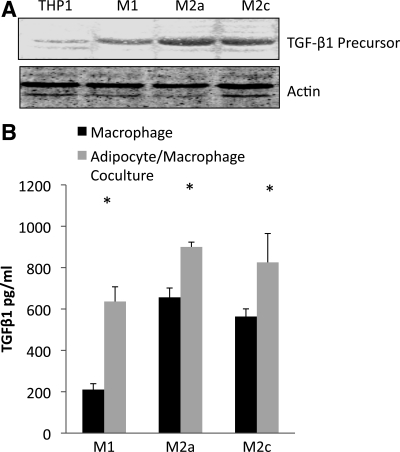
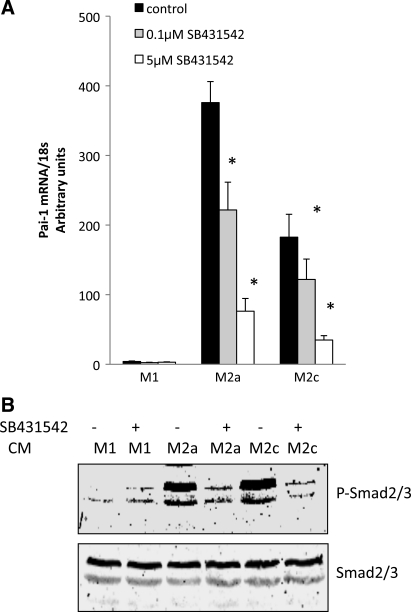
Adipose tissue macrophages are associated with insulin resistance and are linked to changes in the extracellular matrix. To better characterize adipose macrophages, the extracellular matrix, and adipocyte-macrophage interactions, gene expression from adipose tissue and the stromal vascular fraction was assessed for markers of inflammation and fibrosis, and macrophages from obese and lean subjects were counted and characterized immunohistochemically. Coculture experiments examined the effects of adipocyte-macrophage interaction. Collagen VI gene expression was associated with insulin sensitivity and CD68 (r = -0.56 and 0.60, P < 0.0001) and with other markers of inflammation and fibrosis. Compared with adipose tissue from lean subjects, adipose tissue from obese subjects contained increased areas of fibrosis, which correlated inversely with insulin sensitivity (r = -0.58, P < 0.02) and positively with macrophage number (r = 0.70, P < 0.01). Although macrophages in crownlike structures (CLS) were more abundant in obese adipose tissue, the majority of macrophages were associated with fibrosis and were not organized in CLS. Macrophages in CLS were predominantly M1, but most other macrophages, particularly those in fibrotic areas, were M2 and also expressed CD150, a marker of M2c macrophages. Coculture of THP-1 macrophages with adipocytes promoted the M2 phenotype, with a lower level of IL-1 expression and a higher ratio of IL-10 to IL-12. Transforming growth factor-β (TGF-β) was more abundant in M2 macrophages and was further increased by coculture with adipocytes. Downstream effectors of TGF-β, such as plasminogen activator inhibitor-1, collagen VI, and phosphorylated Smad, were increased in macrophages and adipocytes. Thus adipose tissue of insulin-resistant humans demonstrated increased fibrosis, M2 macrophage abundance, and TGF-β activity.
Figures
Similar articles
-
Adipose tissue extracellular matrix and vascular abnormalities in obesity and insulin resistance.J Clin Endocrinol Metab. 2011 Dec;96(12):E1990-8. doi: 10.1210/jc.2011-1567. Epub 2011 Oct 12. J Clin Endocrinol Metab. 2011. PMID: 21994960 Free PMC article.
-
Adipose tissue collagen VI in obesity.J Clin Endocrinol Metab. 2009 Dec;94(12):5155-62. doi: 10.1210/jc.2009-0947. Epub 2009 Oct 16. J Clin Endocrinol Metab. 2009. PMID: 19837927 Free PMC article.
-
Lack of oncostatin M receptor β leads to adipose tissue inflammation and insulin resistance by switching macrophage phenotype.J Biol Chem. 2013 Jul 26;288(30):21861-75. doi: 10.1074/jbc.M113.461905. Epub 2013 Jun 11. J Biol Chem. 2013. PMID: 23760275 Free PMC article.
-
Interrelation of adipose tissue macrophages and fibrosis in obesity.Biochem Pharmacol. 2024 Jul;225:116324. doi: 10.1016/j.bcp.2024.116324. Epub 2024 May 28. Biochem Pharmacol. 2024. PMID: 38815633 Review.
-
Message Transmission Between Adipocyte and Macrophage in Obesity.Adv Exp Med Biol. 2024;1460:273-295. doi: 10.1007/978-3-031-63657-8_9. Adv Exp Med Biol. 2024. PMID: 39287855 Review.
Cited by
-
Innate immune activation in obesity.Mol Aspects Med. 2013 Feb;34(1):12-29. doi: 10.1016/j.mam.2012.10.002. Epub 2012 Oct 13. Mol Aspects Med. 2013. PMID: 23068074 Free PMC article. Review.
-
Adipose tissue biology and cardiomyopathy: translational implications.Circ Res. 2012 Dec 7;111(12):1565-77. doi: 10.1161/CIRCRESAHA.111.262493. Circ Res. 2012. PMID: 23223931 Free PMC article. Review.
-
Fight against fibrosis in adipose tissue remodeling.Am J Physiol Endocrinol Metab. 2021 Jul 1;321(1):E169-E175. doi: 10.1152/ajpendo.00558.2020. Epub 2021 May 31. Am J Physiol Endocrinol Metab. 2021. PMID: 34056922 Free PMC article. Review.
-
Immunological Profiling of Obesity.J Lifestyle Med. 2014 Mar;4(1):1-7. doi: 10.15280/jlm.2014.4.1.1. Epub 2014 Mar 31. J Lifestyle Med. 2014. PMID: 26064849 Free PMC article. Review.
-
Adipose Tissue Fibrosis: Mechanisms, Models, and Importance.Int J Mol Sci. 2020 Aug 21;21(17):6030. doi: 10.3390/ijms21176030. Int J Mol Sci. 2020. PMID: 32825788 Free PMC article. Review.
References
-
- Aron-Wisnewsky J, Tordjman J, Poitou C, Darakhshan F, Hugol D, Basdevant A, Aissat A, Guerre-Millo M, Clement K. Human adipose tissue macrophages: m1 and m2 cell surface markers in subcutaneous and omental depots and after weight loss. J Clin Endocrinol Metab 94: 4619–4623, 2009 - PubMed
-
- Bergman RN, Finegood DT, Ader M. Assessment of insulin sensitivity in vivo. Endocr Rev 6: 45–86, 1985 - PubMed
-
- Boston RC, Stefanovski D, Moate PJ, Sumner AE, Watanabe RM, Bergman RN. MINMOD Millennium: a computer program to calculate glucose effectiveness and insulin sensitivity from the frequently sampled intravenous glucose tolerance test. Diabetes Technol Ther 5: 1003–1015, 2003 - PubMed
-
- Bourlier V, Zakaroff-Girard A, Miranville A, De BS, Maumus M, Sengenes C, Galitzky J, Lafontan M, Karpe F, Frayn KN, Bouloumie A. Remodeling phenotype of human subcutaneous adipose tissue macrophages. Circulation 117: 806–815, 2008 - PubMed
-
- Cinti S, Mitchell G, Barbatelli G, Murano I, Ceresi E, Faloia E, Wang S, Greenberg AS, Obin MS. Adipocyte death defines macrophage localization and function in adipose tissue of obese mice and humans. J Lipid Res 46: 2347–2355, 2005 - PubMed
Publication types
MeSH terms
Substances
Grants and funding
LinkOut - more resources
Full Text Sources
Other Literature Sources