. 2010 Oct 20;29(20):3571-89.
doi: 10.1038/emboj.2010.223. Epub 2010 Sep 14.

Inhibition of mitochondrial fusion by α-synuclein is rescued by PINK1, Parkin and DJ-1

Affiliations

Inhibition of mitochondrial fusion by α-synuclein is rescued by PINK1, Parkin and DJ-1

Frits Kamp et al. EMBO J. .

Abstract

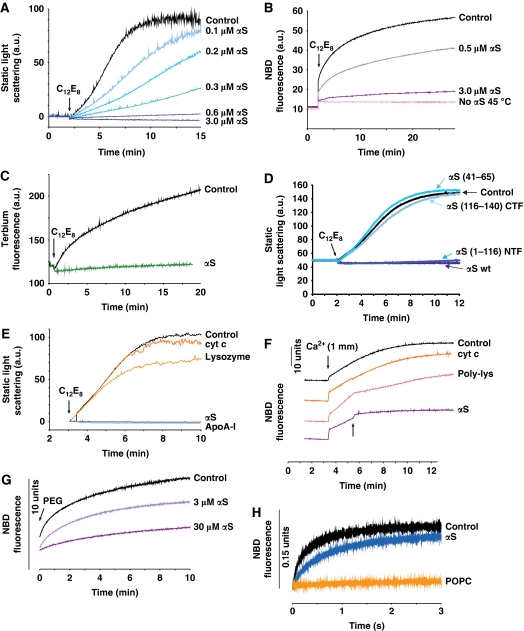
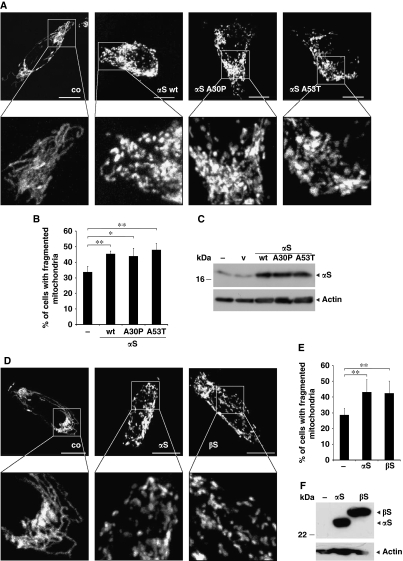
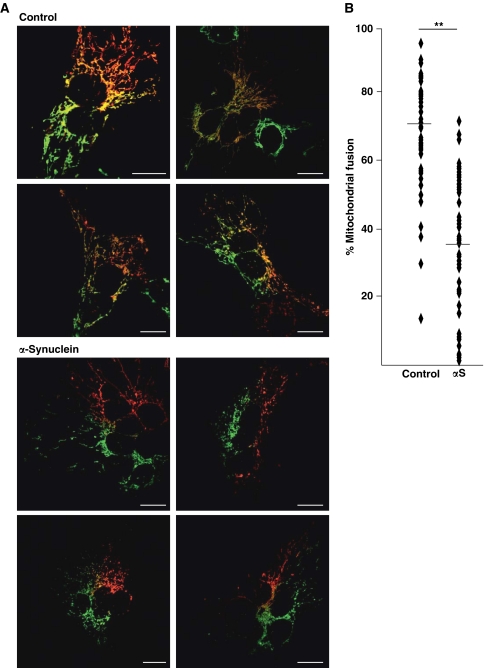
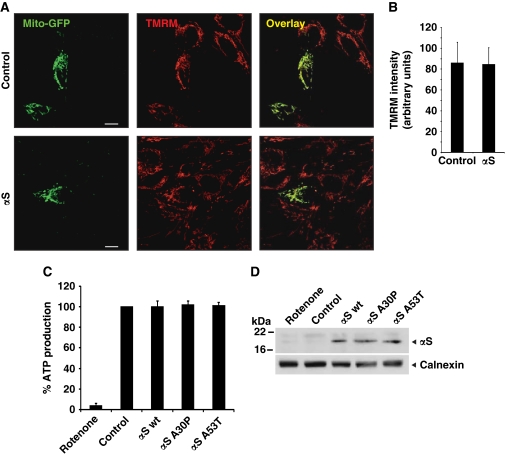
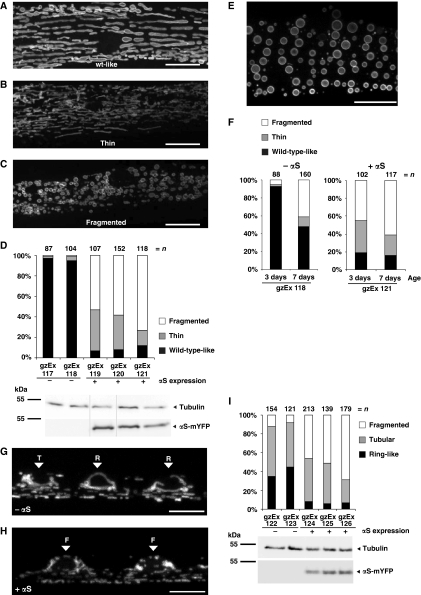
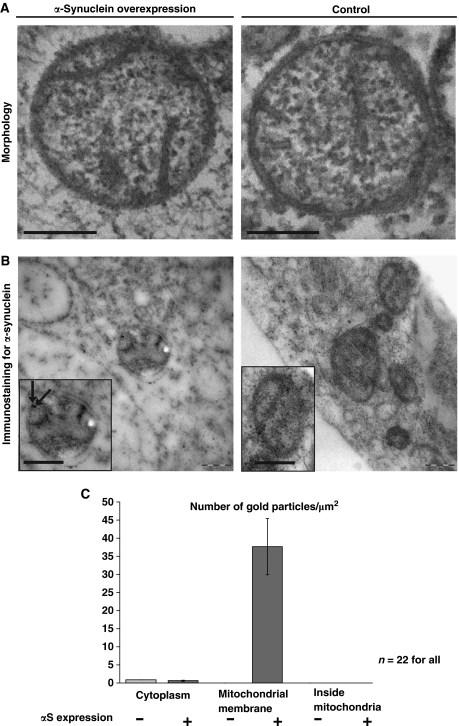
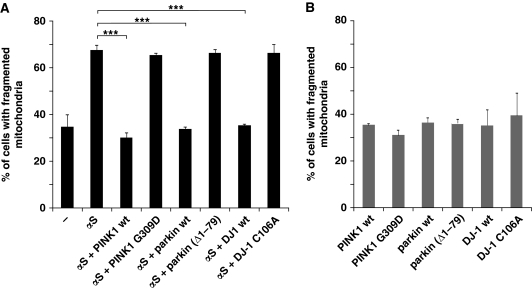
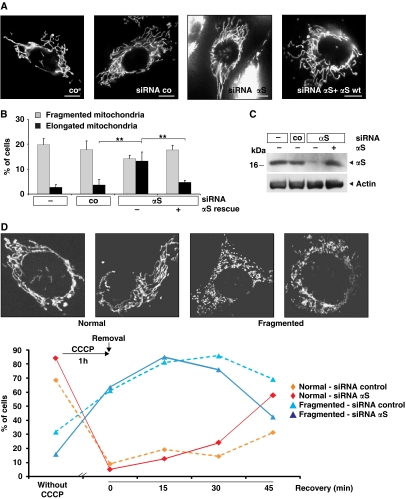
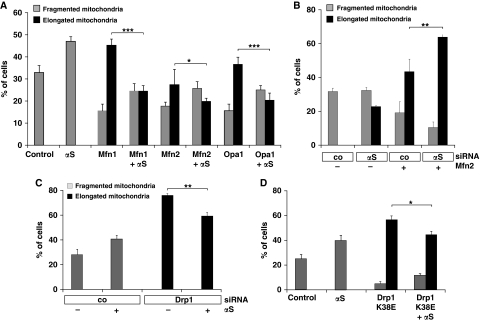
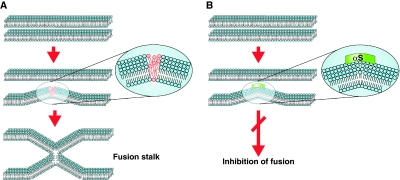
Aggregation of α-synuclein (αS) is involved in the pathogenesis of Parkinson's disease (PD) and a variety of related neurodegenerative disorders. The physiological function of αS is largely unknown. We demonstrate with in vitro vesicle fusion experiments that αS has an inhibitory function on membrane fusion. Upon increased expression in cultured cells and in Caenorhabditis elegans, αS binds to mitochondria and leads to mitochondrial fragmentation. In C. elegans age-dependent fragmentation of mitochondria is enhanced and shifted to an earlier time point upon expression of exogenous αS. In contrast, siRNA-mediated downregulation of αS results in elongated mitochondria in cell culture. αS can act independently of mitochondrial fusion and fission proteins in shifting the dynamic morphologic equilibrium of mitochondria towards reduced fusion. Upon cellular fusion, αS prevents fusion of differently labelled mitochondrial populations. Thus, αS inhibits fusion due to its unique membrane interaction. Finally, mitochondrial fragmentation induced by expression of αS is rescued by coexpression of PINK1, parkin or DJ-1 but not the PD-associated mutations PINK1 G309D and parkin Δ1-79 or by DJ-1 C106A.


Conflict of interest statement

The authors declare that they have no conflict of interest.

Figures

Figure 1
Figure 1
αS inhibits membrane fusion in vitro. (A) Fusion of DPPC-SUV was monitored by the increase in static light scattering upon addition of an aliquot of C12E8. Increasing amounts of αS inhibit membrane fusion (blue lines). Lipid concentration 600 μM, T=36°C. (B) Lipid-mixing assay of DPPC-SUV. αS inhibited fusion completely at lipid/αS=200 mole/mole (purple line). T=35°C. Pink line: no fusion occurred at 45°C, that is at temperature above Tm. (C) Contents-mixing assay carried out in the presence and absence of αS (lipid/αS=200 mole/mole, green line). T=30°C. (D) An N-terminal fragment mutant of αS, αS(1–116) (blue line), lacking the negatively charged C-terminal domain was capable of completely suppressing the fusion of DPPC-SUV, like wt-αS (dark blue line); whereas peptides comprised of the C-terminal fragment, αS(116–140), or the central domain of αS, αS(41–65), failed to inhibit fusion (blue lines). Lipid/protein=100 mole/mole. T=25°C. (E) Comparison of inhibition of membrane fusion by αS with cytochrome c, lysozyme and Apolipoprotein A-I (ApoA-I). For all proteins: lipid/protein=200 mole/mole. T=36°C. (F) Ca2+-induced fusion of POPS-SUV. Fusion was initiated by adding an aliquot of CaCl2 and monitored by the lipid-mixing assay. αS, added 2 min after the addition of Ca2+ (arrow), blocked fusion almost completely (lipid/αS=200 mole/mole). Control experiments: cytochrome c (lipid/protein=20 mole/mole) or poly-lysine (lipid/protein 200 mole/mole) was added instead of αS. T=25°C. (G) SUV of a mixture of lipids with reported optimal fusion potential (DOPC/DOPE/BBSM/cholesterol, 35:30:15:20 molar ratio) (Haque et al, 2001). Fusion was initiated by addition of 4% PEG and followed using the lipid-mixing assay. Total lipid concentration was 300 μM. When the experiment was repeated with αS, fusion was slowed. T=37°C. (H) Spontaneous rapid fusion of SUV composed of lipids with opposite charges (POPS-SUV and PC+-SUV). Lipid-mixing assay performed in stop-flow fluorimetry. Lipid concentration was 60 μM. αS (1.2 μM) inhibited the fusion. When POPS was replaced by POPC (uncharged) no fusion occurred, as expected. T=25°C.
Figure 2
Figure 2
Mitochondrial fragmentation imaged in SH-SY5Y cells expressing αS. (A) Images of fluorescently labelled mitochondria. The panels display representative individual cells either control transfected (co) or transfected with wild-type αS (αS-wt), αS A30P or αS A53T. Scale bars=10 μm. (B) Statistical analyses of mitochondrial morphology of cells from the experiments shown in (A). Approximately 250 cells of each experiment were counted, and the relative amount of transfected cells with altered mitochondrial morphology (i.e. fragmentation) was determined. (C) Expression levels of αS were analysed by western blotting using β-actin as loading control (v, vector). (D) Images of fluorescently labelled mitochondria. The panels display representative individual cells either untransfected (co) or transfected with αS-V5 (αS) or β-synuclein-V5 (βS). Scale bars=10 μm. (E) Statistical analyses of mitochondrial morphology of cells from the experiments shown in (D). Approximately 300 cells of each experiment were counted, and the relative amount of transfected cells with altered mitochondrial morphology (i.e. fragmentation) was determined. Error bars indicate s.d. (F) Expression levels of αS and βS were analysed by western blotting with a V5-antibody using β-actin as loading control. *P⩽0.05, **P⩽0.01.
Figure 3
Figure 3
αS decreases fusion of differentially labelled mitochondrial populations. Cells expressing mito-GFP or mito-DsRed were fused with PEG in the presence or absence of exogenous αS. (A) Confocal images of representative polykaryons are shown. Fusion was monitored by the extent of mito-GFP and mito-DsRed colocalization. Scale bars=15 μm. Upper panel: vector transfected (control); lower panel: αS transfected. (B) Quantification of mitochondrial fusion in αS and control cells. Each dot represents one measured value. Mean values are indicated by horizontal bars. Asterisks indicate significant differences in the percentage of cell hybrids with fused mitochondria compared with the vector control. Expression controls are provided in Supplementary Figure S3.
Figure 4
Figure 4
Mitochondrial function is not impaired by low level expression of αS. (A) SH-SY5Y cells were cotransfected with mito-GFP and vector (control) or αS. Living cells were stained with TMRM and colocalization was determined by overlay. (B) Quantification of TMRM fluorescence intensity. For each condition, n=30 pictures as shown in (A) were quantified. (C) Steady-state cellular ATP levels were measured in SH-SY5Y cells transfected with either vector (control), αS wt, αS A30P or αS A53T. (D) Expression levels of αS were analysed by western blotting using calnexin as loading control. Error bars indicate s.d.
Figure 5
Figure 5
αS expression leads to mitochondrial fragmentation in C. elegans muscles and neurons. (A) In wild-type muscles without expression of αS, mitochondria are forming regular tubular structures. (B, C) Expression of human αS leads to changes in mitochondrial morphology, which can be classified into two categories: (B) very thin and highly interconnected tubules and (C) fragmented vesicular mitochondria. Scale bars=10 μm. (D) Quantification of the relative appearance of wild-type-like, fragmented, and thin mitochondria in independent transgenic lines expressing αS-mYFP. Expression levels of αS-mYFP were analysed by western blot using tubulin as a loading control. All lanes originate from the same gel. Only the lanes of those transgenic lines, which were chosen for imaging due to good penetrance and fluorescent signal, are shown here. (E) Mitochondrial fragmentation is also observed in aged 7-day-old wild-type body wall muscles. Scale bar=10 μm. (F) Mitochondrial morphologies are compared between 3 day versus 7-day-old muscles without (right graph) and with αS-mYFP expression (left graph). (G, H) Images show TOM70-CFP-labelled mitochondria in motoneurons of young adult C. elegans. Arrowheads label neuronal cell bodies, indicating the morphological category. The mitochondrial morphology in neuronal cell bodies was grouped into three categories: ring-like [R], tubular [T] or fragmented [F] mitochondria. Wild-type neurons mostly contain ring-like and long tubular mitochondria (G), whereas αS-expressing neurons show mostly fragmented mitochondria in cell bodies as well as in the axons (H). Scale bars=5 μm. (I) Quantification of relative occurrence of ring-like, tubular and fragmented mitochondria and αS-mYFP expression levels.
Figure 6
Figure 6
αS binds to mitochondrial outer membranes. (A) Electron microscopy of mitochondria in cells overexpressing αS (left panel) and without overexpression (control, right panel). Scale bars=200 nm. (B) Immunostaining for αS. Insets: Mitochondria in high magnification. Arrows indicate localization of αS. Scale bars=200 nm. (C) Statistical analysis of the density of immunogold labelling in the cytosol, at the mitochondrial membrane and inside the mitochondria, comparing αS overexpressing cells (+) and the control without overexpression (−). No label inside the mitochondria was detected in both samples. Error bars indicate s.d.
Figure 7
Figure 7
Expression of three familial PD-associated genes rescues mitochondrial fragmentation caused by αS. (A) Coexpression of PINK1, parkin or DJ-1 with αS rescues fragmentation of mitochondria, whereas their loss-of-function mutants do not. Cells were transfected as indicated and mitochondrial morphology was quantitated as in Figure 2B. (B) Single expression of PINK1, parkin or DJ-1 or each mutant alone does not affect mitochondrial morphology. Error bars indicate s.d. Expression controls are provided in Supplementary Figure S4. ***P⩽0.001.
Figure 8
Figure 8
Loss of αS induces elongation of mitochondria. (A) Images of fluorescently labelled mitochondria. The panels display representative individual cells either untransfected (co) or transfected with control-siRNA, αS-siRNA, and αS-siRNA+αS-cDNA. Scale bar=10 μm. (B) Statistical analyses of mitochondrial morphology of cells from the experiments shown in (A). Approximately 300 cells of each experiment were counted, and the relative amount of cells with changed mitochondrial morphology (i.e. fragmentation or elongation) was determined. Error bars indicate s.d. (C) Downregulation of αS in SH-SY5Y cells and retransfection with wild-type αS was monitored by western blotting using β-actin as a loading control. (D) Analyses of mitochondrial morphology of cells transfected with a control siRNA or an siRNA against αS before exposure to 10 μM CCCP for 1 h and at different recovery times after removal of CCCP. Insets show images of fluorescently labelled mitochondria. The panels display representative mitochondrial phenotypes as observed before (normal) and after (fragmented) exposure to CCCP. Scale bars=10 μm. Approximately 60 cells of each experiment were counted, and the relative amount of transfected cells with normal or fragmented mitochondrial morphology was determined. **P⩽0.01.
Figure 9
Figure 9
αS-mediated mitochondrial fragmentation is independent of the fusion and fission machinery. (A) Cells were transfected with Mfn1, Mfn2, Opa1 and αS as indicated. The relative amounts of cells with changed mitochondrial morphology (i.e. fragmentation or elongation) were determined. (B) Cells were transfected with control siRNA or siRNA directed against αS and cotransfected with Mfn2 where indicated. The relative amounts of cells with altered mitochondrial morphology (i.e. fragmentation or elongation) were determined. (C) Cells were transfected with control siRNA or Drp1-specific siRNA and cotransfected with αS where indicated, fluorescently labelled and the relative amounts of cells with fragmented or elongated mitochondria were determined. (D) Cells were transfected with vector (control), αS and Drp1 K38E where indicated, and the relative amounts of cells with fragmented or elongated mitochondria were determined. Error bars indicate s.d. Expression controls are provided in Supplementary Figure S6. *P⩽0.05, **P⩽0.01, ***P⩽0.001.
Figure 10
Figure 10
A model of inhibition of membrane fusion by αS. (A) Formation of a fusion stalk in the absence of αS. Two membranes achieve close proximity, possibly assisted by a docking machine (not drawn). Curvature in at least one of the fusing membranes causes stress in the packing of the lipids (see inset, the red lipids are not ideally packed), which is necessary to enable fusion of the leaflets of the two fusing membranes and the formation of a fusion stalk. (B) Binding of αS to curved membranes seals the packing defects and therefore inhibits the formation of a fusion stalk.

References

    1. Abeliovich A, Schmitz Y, Farinas I, Choi-Lundberg D, Ho WH, Castillo PE, Shinsky N, Verdugo JM, Armanini M, Ryan A, Hynes M, Phillips H, Sulzer D, Rosenthal A (2000) Mice lacking alpha-synuclein display functional deficits in the nigrostriatal dopamine system. Neuron 25: 239–252 - PubMed
    1. Ben Gedalya T, Loeb V, Israeli E, Altschuler Y, Selkoe DJ, Sharon R (2009) Alpha-synuclein and polyunsaturated fatty acids promote clathrin-mediated endocytosis and synaptic vesicle recycling. Traffic 10: 218–234 - PMC - PubMed
    1. Beyer K (2007) Mechanistic aspects of Parkinson's disease. α-synuclein and the biomembrane. Cell Biochem Biophys 47: 285–299 - PubMed
    1. Bodner CR, Dobson CM, Bax A (2009) Multiple tight phospholipid-binding modes of alpha-synuclein revealed by solution NMR spectroscopy. J Mol Biol 390: 775–790 - PMC - PubMed
    1. Cabin DE, Shimazu K, Murphy D, Cole NB, Gottschalk W, McIlwain KL, Orrison B, Chen A, Ellis CE, Paylor R, Lu B, Nussbaum RL (2002) Synaptic vesicle depletion correlates with attenuated synaptic responses to prolonged repetitive stimulation in mice lacking alpha-synuclein. J Neurosci 22: 8797–8807 - PMC - PubMed

Publication types

MeSH terms