. 2010 Jun 28:1:80-92.
doi: 10.7150/jca.1.80.

Cancer Response Criteria and Bone Metastases: RECIST 1.1, MDA and PERCIST

Affiliations

Cancer Response Criteria and Bone Metastases: RECIST 1.1, MDA and PERCIST

Colleen M Costelloe et al. J Cancer. .

Abstract

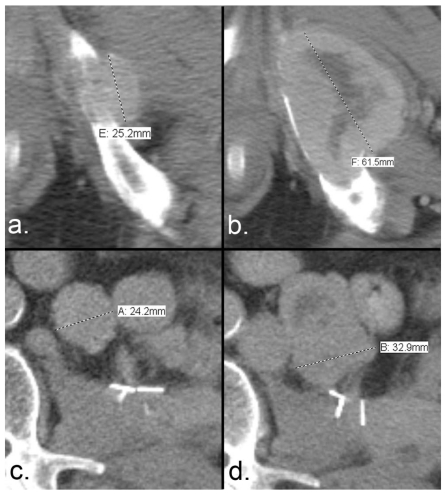
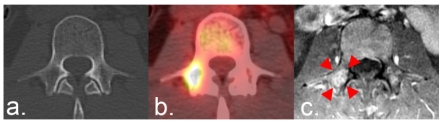
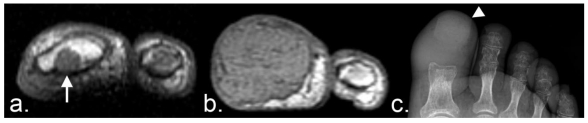
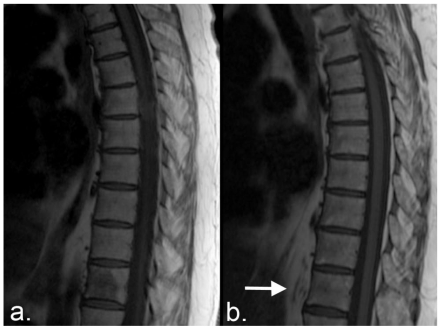
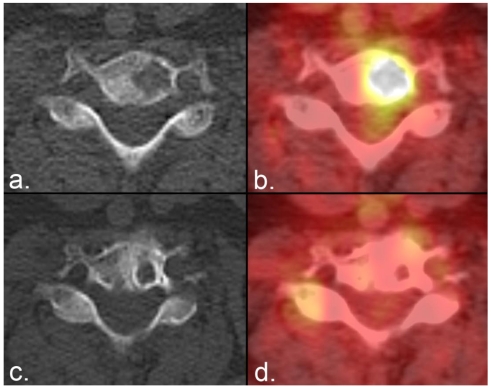
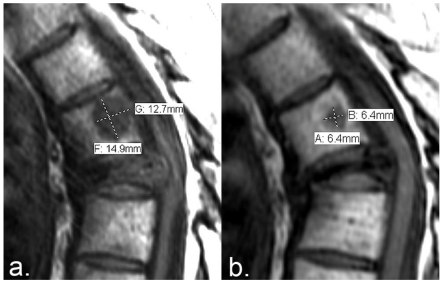
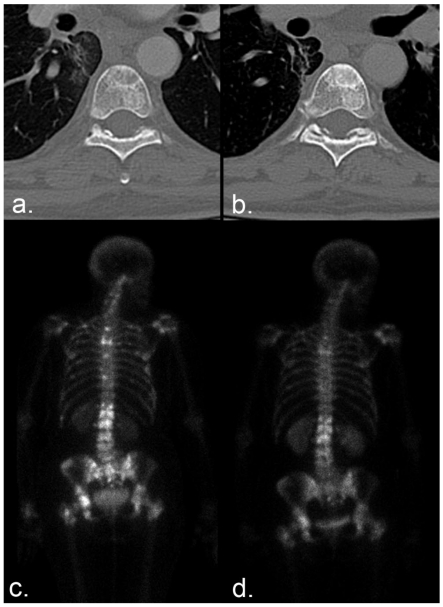
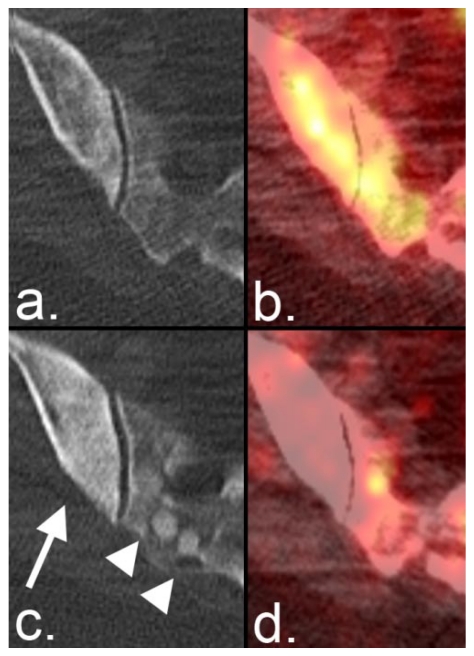
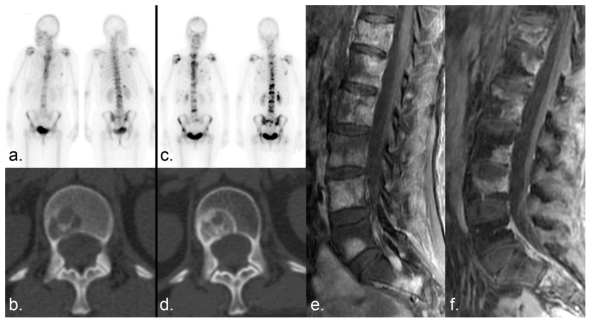
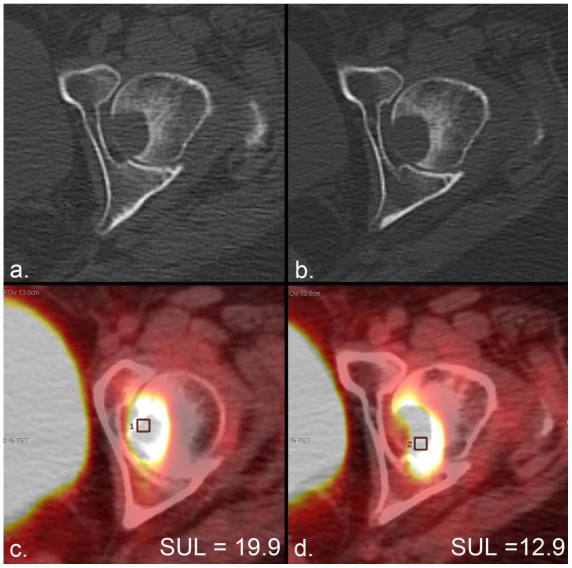
Response criteria represent the standard by which the efficacy of therapeutic agents is determined in cancer trials. The most widely used criteria are based on the anatomic measurement of solid tumors. Because bone metastases are typically located in irregularly shaped bones and are difficult to measure with rulers, they have been previously considered unmeasurable disease. New developments in cancer response criteria have increased awareness of the importance of the response of bone metastases to therapy. The recently updated Response Evaluation Criteria in Solid Tumors (RECIST 1.1) now consider bone metastases with soft tissue masses > 10 mm to be measurable disease. Response criteria specific to bone metastases have been developed at The University of Texas MD Anderson Cancer Center (MDA criteria) and can be used to assess therapeutic response in numerous types of bone metastases. Functional imaging criteria, such as the recently developed Positron Emission Tomography Response Criteria in Solid Tumors (PERCIST) allow response to be measured in the absence of anatomic change through assessment of metabolic activity. As monitoring tumor response of bone metastases becomes more important in the management of cancer, so does the demand on radiologists and nuclear medicine physicians for accurate interpretation of the behavior of these lesions. This article reviews anatomic, bone, and metabolic response criteria, providing illustrations for the interpretation of therapy-induced change in bone metastases.

Keywords: MDA; PERCIST; RECIST 1.1; bone; metastasis; response criteria.


Conflict of interest statement

Conflict of Interest: The authors have declared that no conflict of interest exists.

Figures

Figure 1
Figure 1
Measurement of disease progression using the RECIST 1.1 criteria. (a) Axial CT of the pelvis and abdomen of a patient with renal cell carcinoma demonstrates a bone metastasis in the left inferior pubic ramus. The soft tissue component is > 10 mm, and (b) the short-axis diameter of the left retroperitoneal lymph node metastasis is >15 mm; both are considered measurable according to RECIST 1.1. The sum of the longest diameters is used to assess tumor response. (c) The bone metastasis has increased from 25.2 mm to 61.5 mm, and (d) the nodal metastasis has increased from 24.2 mm to 32.9 mm. The sum of the 2 lesions at the first time point is 49.4 mm, and the sum at the second time point is 94.4 mm. This increase of 91% exceeds the required > 20% increase that is necessary to qualify for the progressive disease category.
Figure 2
Figure 2
Use of FDG PET/CT according to the RECIST 1.1 criteria. (a) CT of the L3 vertebra in a patient with breast cancer reveals no indication of bone metastases. (b) Focal FDG uptake indicative of metastatic disease is present on PET/CT. The interval development of an FDG-avid focus, in the absence of any other indication of disease progression, is considered progressive disease under RECIST 1.1 unless it corresponds to a pre-existing, anatomically stable abnormality. RECIST 1.1 specifies that the metastasis is to be confirmed on a follow-up CT.(c) A fat-saturated T1-weighted axial MRI image obtained following the administration of intravenous contrast was available and reveals an enhancing lesion in the location of FDG uptake (arrowheads), confirming the presence of the metastasis.
Figure 3
Figure 3
Unequivocal progression of unmeasurable disease according to the RECIST 1.1 criteria. (a)T1-weighted axial MRI of a patient with renal cell carcinoma demonstrates a small metastasis in the marrow cavity of the distal phalanx of the left great toe (arrow). Bone disease without a soft tissue mass ≥ 10 mm is considered unmeasurable disease under RECIST 1.1. (b) Eight months later, the metastasis has markedly enlarged, representing unequivocal progression of unmeasurable disease. (c) A frontal radiograph of the foot demonstrates complete cortical lysis of the distal phalanx. The toenail is evident (arrowhead). Periarticular osteopenia is likely secondary to disuse.
Figure 4
Figure 4
Complete response on MRI using the MDA criteria. (a) T1-weighted sagittal MRI of the thoracic spine of a patient with breast cancer demonstrates a lesion in the T11 vertebral body with abnormally low T1 signal intensity. (b) Eight years later, the lesion has been replaced by normal fat signal (arrow). The upper thoracic spine is slightly tilted in position on the follow-up examination. The response is complete according to the MDA criteria.
Figure 5
Figure 5
Partial response on radiographs according to the MDA criteria. (a) A lytic metastasis is seen in the C7 vertebral body on CT in a patient with breast cancer. (b) Fused PET/CT image from the same examination demonstrates FDG uptake representing active tumor. (c) Five weeks later, the lesion developed a sclerotic rim that resulted in a reduction in the size of the lytic area. (d) Fused PET/CT image from the same examination as (c) shows resolution of FDG activity, confirming the positive anatomic response.
Figure 6
Figure 6
Quantitative measurement of PR using the MDA criteria. (a) T1-weighted sagittal MRI of the thoracic spine of a patient with multiple myeloma demonstrates a lesion with abnormally low T1 signal intensity in the T5 vertebral body. (b) Seven months later, fat reconstitution occurred around the periphery of the lesion, resulting in a decrease in the size of the metastasis. The sum of the perpendicular dimensions of the lesion has decreased from 27.6 mm to 12.8 mm (a 52% reduction in size), qualifying as partial response according to the MDA criteria (≥ 50% reduction required). The metastasis to the severely compressed T6 vertebral body is an example of a lesion that remains unmeasurable with anatomic response criteria.
Figure 7
Figure 7
Differentiation of PR from CR using the MDA criteria. (a) CT of the T6 vertebra in a patient with breast cancer demonstrates a mixed lytic/blastic metastasis in the anterior aspect of the vertebral body. (b) The lesion shows complete sclerotic fill-in 3 months later. In isolation, this response qualifies as complete response even though progressive sclerosis may be seen on subsequent examinations. (c, d) However, companion Tc 99m methylene diphosphonate (MDP) bone scans show improvement but not complete resolution of MDP uptake. The patient's response is therefore considered partial.
Figure 8
Figure 8
Osteoblastic flare. (a) The CT portion of an FDG PET/CT of the pelvis of a patient with breast cancer shows scattered lytic and blastic metastases in the bony pelvis. (b) Fused PET/CT shows significant tracer uptake in the right iliac bone and right sacral ala, indicative of metabolically active disease. (c) Nine months later, the iliac lesion demonstrates sclerosis (arrow), and 2 round sclerotic lesions are now seen in the right sacral ala (arrowheads). In isolation, these findings might be representative of disease progression, but lytic lesions in other locations (not shown) demonstrated sclerotic fill-in, raising the possibility of an osteoblastic flare rather than progressive disease. (d) Fused image from the same examination shows marked decrease in metabolic activity, confirming positive response to therapy and osteoblastic flare on the CT portion of the examination.
Figure 9
Figure 9
Scintigraphic flare. (a) Numerous bone metastases show tracer uptake on a Tc 99m MDP bone scan in a patient with breast cancer. (b) Companion CT examination demonstrates a lytic metastasis in the L1 vertebral body. (c) Six months later, the lesions demonstrate increased tracer uptake. (d) Companion CT shows sclerotic fill-in of the lytic lesion, which can occur with disease progression or healing. (e, f) Fat-saturated T1-weighted sagittal MRI examinations of the lumbar spine obtained (e) 1 month and (f) 2 months after the bone scans show a decrease in the size and/or enhancement of the metastases, indicating a positive response to therapy. Incidental note is made of interval insufficiency fracture of the superior endplate of L4 on (f). The increased MDP uptake on the bone scan (b) was the result of healing sclerosis and representative of a scintigraphic flare in a patient undergoing partial response rather than progressive disease.
Figure 10
Figure 10
Metabolic response according to the PERCIST criteria in the absence of anatomic response. (a) The CT portion of an FDG PET/CT scan in a patient with lung cancer demonstrates a lytic metastasis in the left femoral head. (b) The CT from a PET/CT scan 2 months later demonstrates no anatomic change. (c, d) The standardized uptake value corrected for lean body mass (SUL) peak (average SUL in a 1-cm3 region of interest centered at the most active part of each tumor) changes from (c) 19.8 to (d) 12.9, representing a 35% decrease that satisfies the minimal requirements for partial response (> 30%) according to PERCIST. Assessment of tumor metabolism allowed therapeutic response to be measured in the absence of any other indication of change.

References

    1. Cancer Facts & Figures 2010. American Cancer Society; http://www.cancer.org/downloads/STT/Cancer_Facts_and_Figures_2010.pdf.
    1. Abrams HL, Spiro R, Goldstein N. Metastases in carcinoma; analysis of 1000 autopsied cases. Cancer. 1950;3:74–85. - PubMed
    1. Coleman RE. Clinical features of metastatic bone disease and risk of skeletal morbidity. Clin Cancer Res. 2006;12:6243s–6249s. - PubMed
    1. WHO. WHO handbook for reporting results of cancer treatment. Geneva (Switzerland): World Health Organization Offset Publication; 1979.
    1. Miller AB, Hoogstraten B, Staquet M, Winkler A. Reporting results of cancer treatment. Cancer. 1981;47:207–214. - PubMed