

Risk prediction using genome-wide association studies
- PMID: 20842684
- PMCID: PMC2964405
- DOI: 10.1002/gepi.20509
Risk prediction using genome-wide association studies
Abstract
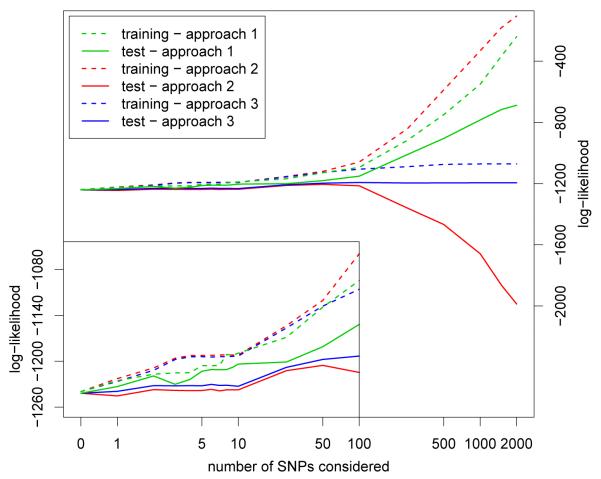
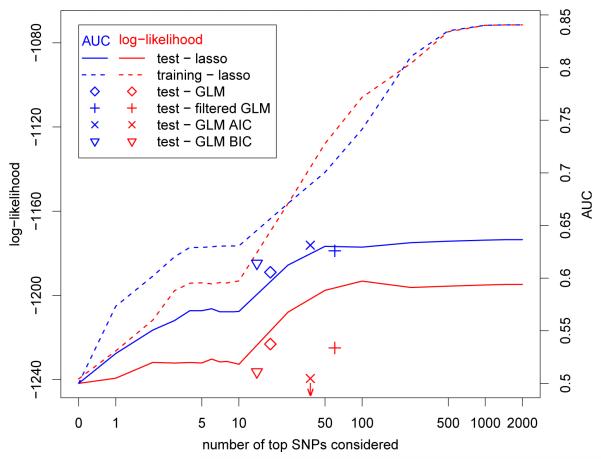
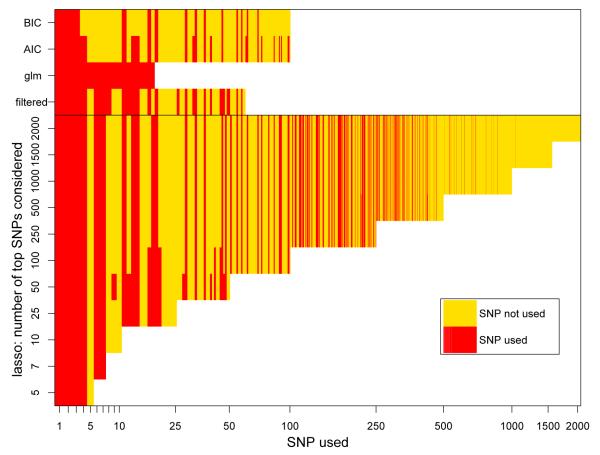
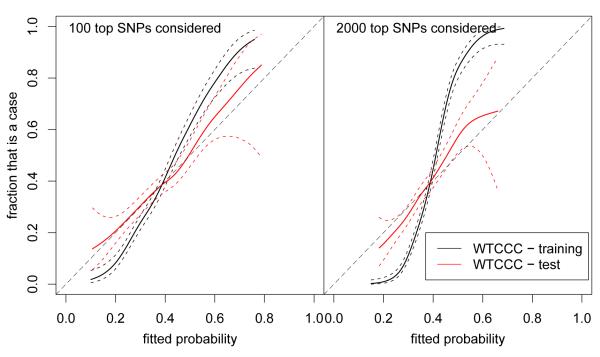
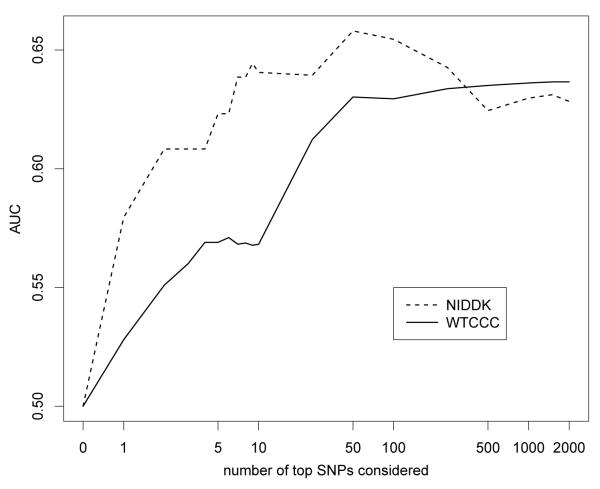
Over the last few years, many new genetic associations have been identified by genome-wide association studies (GWAS). There are potentially many uses of these identified variants: a better understanding of disease etiology, personalized medicine, new leads for studying underlying biology, and risk prediction. Recently, there has been some skepticism regarding the prospects of risk prediction using GWAS, primarily motivated by the fact that individual effect sizes of variants associated with the phenotype are mostly small. However, there have also been arguments that many disease-associated variants have not yet been identified; hence, prospects for risk prediction may improve if more variants are included. From a risk prediction perspective, it is reasonable to average a larger number of predictors, of which some may have (limited) predictive power, and some actually may be noise. The idea being that when added together, the combined small signals results in a signal that is stronger than the noise from the unrelated predictors. We examine various aspects of the construction of models for the estimation of disease probability. We compare different methods to construct such models, to examine how implementation of cross-validation may influence results, and to examine which single nucleotide polymorphisms (SNPs) are most useful for prediction. We carry out our investigation on GWAS of the Welcome Trust Case Control Consortium. For Crohn's disease, we confirm our results on another GWAS. Our results suggest that utilizing a larger number of SNPs than those which reach genome-wide significance, for example using the lasso, improves the construction of risk prediction models.
© 2010 Wiley-Liss, Inc.
Figures
References
-
- Cook NR. Use and misuse of the Receiver Operating Characteristic curve in risk prediction. Circulation. 115:928–935. - PubMed
-
- Donoho DL, Johnstone IM. Ideal spatial adaptation via wavelet shrinkage. Biometrika. 1994;81:425–455.
-
- Duerr RH, Taylor KD, Brant SR, Rioux JD, Silverberg MS, Daly MJ, Steinhart AH, Abraham C, Regueiro M, Griffiths A, Dassopoulos T, Bitton A, Yang H, Targan S, Data LW, Kistner EO, Schumm P, Lee AT, Gregersen PK, Barmada MM, Rotter JI, Nicolae DL, Cho JH. A genome-wide association study identifies IL23R as an inflammatory bowel disease gene. Science. 2006;314:1461–1463. - PMC - PubMed
-
- Evans DM, Visscher PM, Wray NM. Harnessing the information contained with genome-wide association studies to improve individual prediction of complex disease risk. Hum Mol Gen. 2009;18:3525–3531. - PubMed
Publication types
MeSH terms
Grants and funding
LinkOut - more resources
Full Text Sources
Other Literature Sources
