Comparative Study
. 2011 Jan;41(1):138-46.
doi: 10.1016/j.nbd.2010.09.001. Epub 2010 Sep 16.

Cerebellar abnormalities following hypoxia alone compared to hypoxic-ischemic forebrain injury in the developing rat brain

Affiliations
Comparative Study

Cerebellar abnormalities following hypoxia alone compared to hypoxic-ischemic forebrain injury in the developing rat brain

Valerie Biran et al. Neurobiol Dis. 2011 Jan.

Abstract

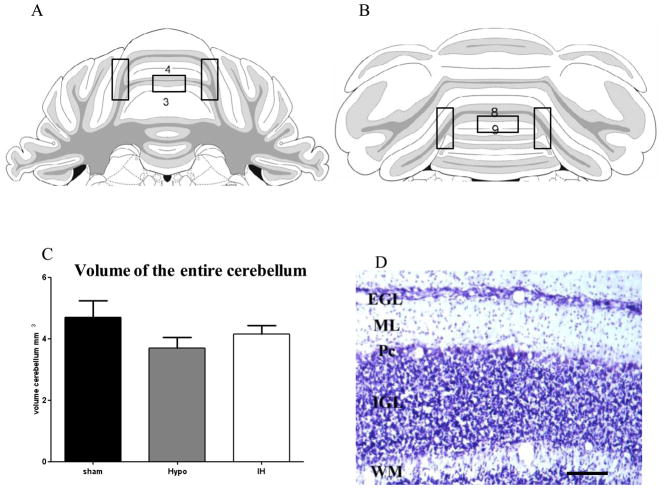
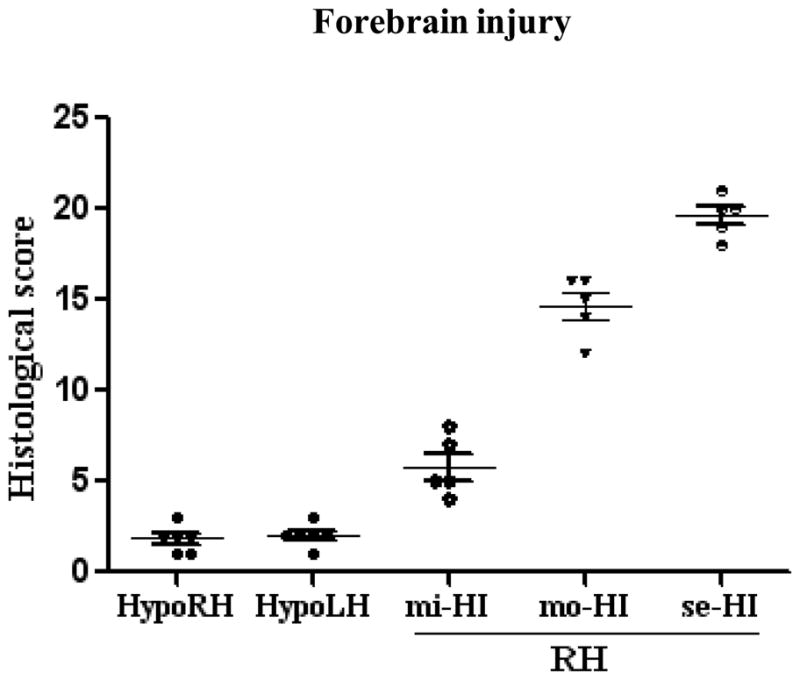
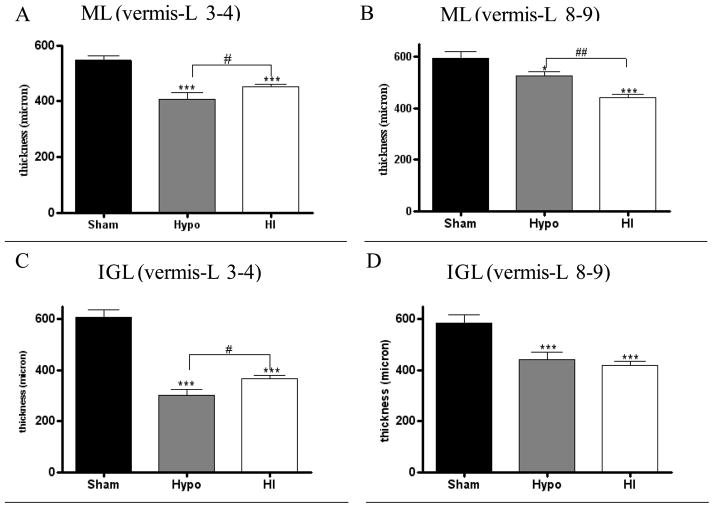
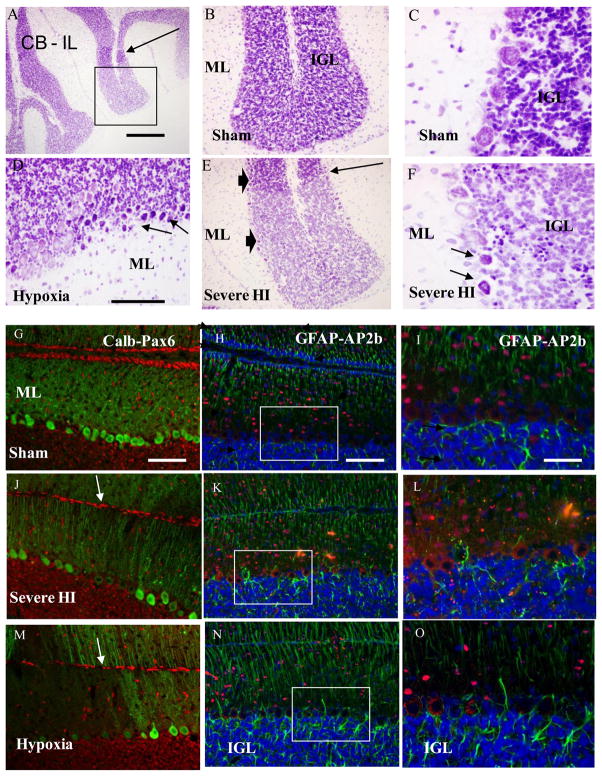
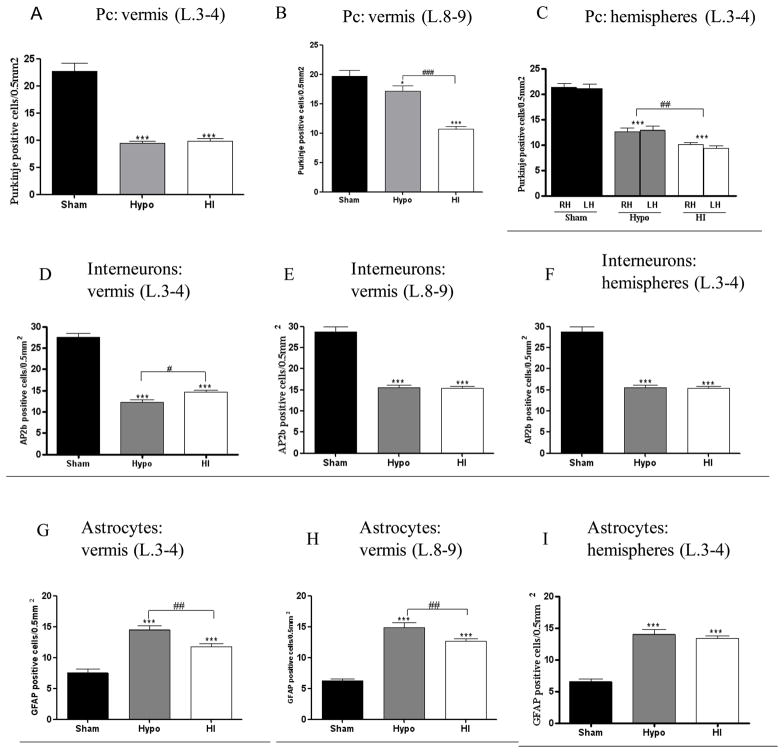
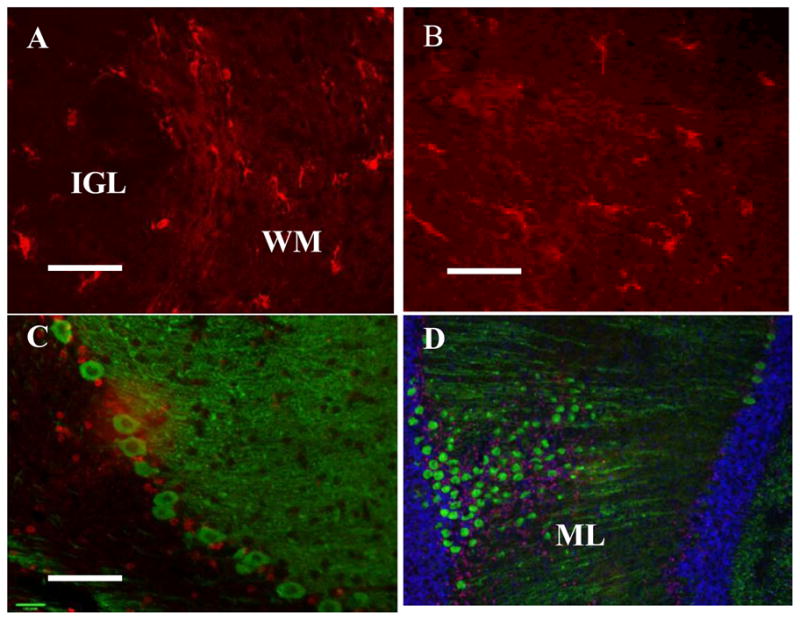
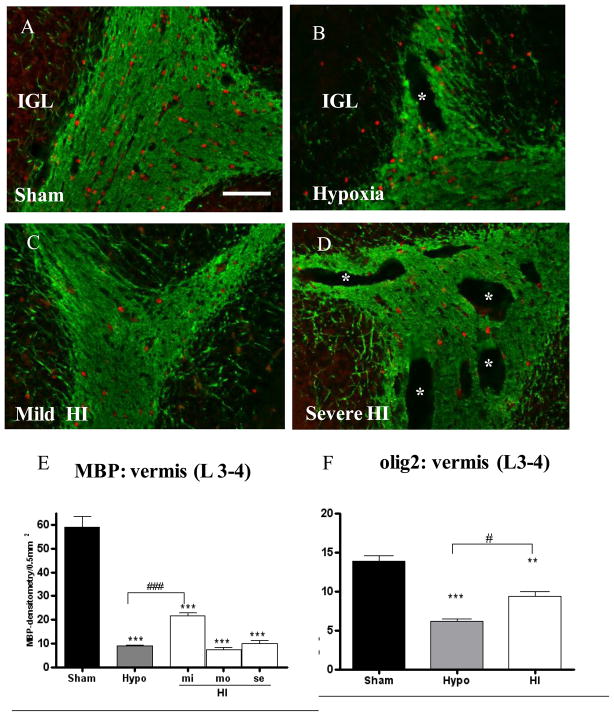
Two-day-old (P2) rat pups were subjected to either a global hypoxia or to electrocoagulation of the right carotid artery followed by 2.5 h hypoxia. Cellular and regional injury in the cerebellum (CB) was studied at 1, 2 and 19 days using immunohistology. Following hypoxia and hypoxia-ischemia, all neuronal populations of the CB were damaged in a subset of Purkinje cells. The decrease in the number of interneurons, as well as the thickness of molecular and granular layers was significant following hypoxia. Diffuse white matter damage, with loss of preoligodendrocytes was more severe following hypoxia than hypoxia-ischemia. Global hypoxia in the rat at P2 produces extensive damage to many cell types in different areas of the CB. The addition of unilateral forebrain ischemia does not increase the severity of these changes. Our data provide insight into the mechanisms of the changes observed in the CB of premature newborns.


Figures

Figure 1
Figure 1
Schematic of coronal sections from the anterior (A) and posterior levels of the cerebellum (B). Boxes indicated the regions observed for immunochemistry and quantitative assessment (lobules (L) 3-4 and 8-9), from Paxinos G and Watson C, The Rat Brain in stereotaxic coordinates, 5th edition. (C) Measurement of the entire volume of cerebellum by stereologic analysis at P21 with no significant difference between all groups, hypoxic (Hypo) and hypoxic-ischemic animals (HI) Nissl stain section of the white matter (WM), internal granular layer (IGL), molecular layer (ML) and external granular layer (EGL) in sham animals at P21 (of L 3-4) (D). Pc: Purkinje cell layer. Scale bar: 50 μm.
Figure 2
Figure 2
Evaluation of the degree of forebrain injury at P21in right (RH) and left (LH) hemispheres of hypoxic (Hypo) and hypoxic-ischemic (HI) animals: (mi-HI), moderate, (mo-HI), severe (se-HI). Note the same median histological score in both cerebral hemispheres in Hypo animals, and the increasing histological score in RH in HI animals (from 5–21) showing the variability in the model.
Figure 3
Figure 3
Assessments of thickness of the molecular layer (ML) in the lobules 3-4 (L 3-4; anterior vermis), (A) and lobules 8-9 (L 8-9; posterior vermis), (B) of the internal granular layer (IGL) in the L 3-4 (C) and L 8-9 (D) vermis of sham, hypoxic (Hypo) and hypoxic-ischemic (HI) animals. Bar represents mean density of positive cells ± s.e.m. Asterisks indicate significant difference compared to sham; *** p< 0.001, ** p< 0.01, * p< 0.05. Hash sign indicate significant difference between H compared to HI animals; ### p< 0.001, ## p< 0.01, # p< 0.05
Figure 4
Figure 4
Nissl staining in P21 Sham (A–C), hypoxic (Hypo) (D), and severe hypoxic-ischemic (HI) animals (E–F). Boxes in A indicated the enlargement showed in B. Note the clear staining of Purkinje cells in anterior region of the cerebellum in control (C), compared to the abnormal dense staining following hypoxia (D) and severe HI (E–F). Short arrows point to injured Purkinje cells (Pc) in D, F and long arrows the stripe in Sham (A) and severe HI (E). Arrowheads in E showed the high density of Pc in the upper stripe whereas the lower contiguous stripe showed only few Pc. Scale bars = A: 300 μm, B, E: 100μm, C, D, F: 40μm. Double-labeling Calbindin (green) - Pax6 (red) (G, J, M) and GFAP (green) - AP2β (red), (H, I, K, L, N, O) in Sham (G, H, I), severe HI (J, K, L) and H (M, N, O) sections. Boxes in H, K, N are enlarged in I, L, O. (G, J, M) Note gaps with no cell bodies in the Pc layer associated with less dendrites in the molecular layer (ML) and a thin external granular layer indicated by arrow in J, M compared to that observed in G. (H, I, K, L, N, O) Note the decrease in density of interneurons (AP2 β) in K, L, N, O compared to Sham (H, I) The blue fluorescence is due to the nuclear counterstaining with Hoechst 33258. Scale bars = A, B, D, E, G, H: 50 μm; C, F, I: 20μm.
Figure 5
Figure 5
Purkinje cell quantification in the lobules (L) 3-4 (A) and 8-9 of the vermis (B) and right (RH) and left (LH) hemispheres (C) of Sham, hypoxic (Hypo) and hypoxic-ischemic (HI) animals. Quantification in Sham, Hypo and HI animals of interneuron (AP2b positive cells) in the L 3-4 (D), L 8-9 (E) of the vermis and both hemispheres (F); GFAP-positive cells in the L 3-4 (G), l 8-9 (H) vermis and both hemispheres (I) of Sham, Hypo and HI animals. Bar represents mean density of positive cells ± s.e.m. Asterisks indicate significant difference from black bars; ** p< 0.01, * p< 0.05. Hash sign indicate significant difference between H compared to HI animals; ### p< 0.001, ## p< 0.01, # p< 0.05
Figure 6
Figure 6
(A–B) Activated microglia (red-iba1) in the white matter fiber tracts (WM) at P3. (C–D) Following neonatal forebrain hypoxic-ischemic injury, caspase 3 activation (red) is present in the Purkinje cell layer and molecular layer (ML) but no colocalization with Purkinje cells (green-calbindin) is detected at P3. Scale bar D: 100 μm; A, B, C: 50μm
Figure 7
Figure 7
Myelin Binding Protein (MBP, green) and Olig2 (red) double-labeling in (A) Sham, (B) hypoxic (Hypo), (C) mild (mi-HI), (D) severe hypoxic-ischemic (se-HI) animals at P21. MBP labeling showed a severe loss of myelin and cystic features (*) in cerebellar white matter after Hypo (B) and HI (C–D). In (B) Hypo and (D) se-HI animals, all cerebellum exhibited evidence of myelination defect associated with reduced Olig-2 staining. Scale bar: 50μm (E) Quantification of MBP (densitometry) in the lobules (L) 3-4 of the vermis of Sham, Hypo and HI animals. Mild (mi), moderate, (mo), and severe (se) HI are evaluated. (F) Quantification of preoligodendrocytes (Olig-2 positive cells) in the L 3-4 of the vermis of Sham, Hypo and HI animals. Bar represents mean density of positive cells ± s.e.m. Asterisks indicate significant difference from black bars; *** p< 0.001, ** p< 0.01, * p< 0.05. Hash sign indicate significant difference between H compared to HI animals; ### p< 0.001, ## p< 0.01, # p< 0.05

Similar articles

Cited by

References

    1. Allin M, et al. Cognitive and motor function and the size of the cerebellum in adolescents born very pre-term. Brain. 2001;124:60–6. - PubMed
    1. Altman J, Bayer SA. Embryonic development of the rat cerebellum. III. Regional differences in the time of origin, migration, and settling of Purkinje cells. J Comp Neurol. 1985;231:42–65. - PubMed
    1. Azizi SA, et al. The pontocerebellar system in the rat: an HRP study. I. Posterior vermis. J Comp Neurol. 1981;197:543–8. - PubMed
    1. Baud O, et al. Gestational hypoxia induces white matter damage in neonatal rats: a new model of periventricular leukomalacia. Brain Pathol. 2004;14:1–10. - PMC - PubMed
    1. Berquin PC, et al. Cerebellum in attention-deficit hyperactivity disorder: a morphometric MRI study. Neurology. 1998;50:1087–93. - PubMed

Publication types