. 2010 Nov 19;285(47):36656-65.
doi: 10.1074/jbc.M110.161471. Epub 2010 Sep 15.

Structural and functional analysis of transmembrane segment VI of the NHE1 isoform of the Na+/H+ exchanger

Affiliations

Structural and functional analysis of transmembrane segment VI of the NHE1 isoform of the Na+/H+ exchanger

Jennifer Tzeng et al. J Biol Chem. .

Abstract

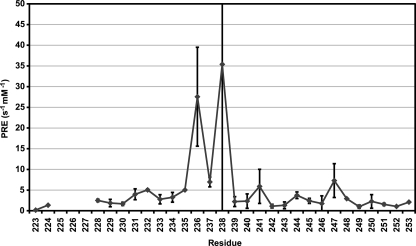
The Na(+)/H(+) exchanger isoform 1 is a ubiquitously expressed integral membrane protein. It resides on the plasma membrane of cells and regulates intracellular pH in mammals by extruding an intracellular H(+) in exchange for one extracellular Na(+). We characterized structural and functional aspects of the transmembrane segment (TM) VI (residues 227-249) by using cysteine scanning mutagenesis and high resolution NMR. Each residue of TM VI was mutated to cysteine in the background of the cysteineless NHE1 protein, and the sensitivity to water-soluble sulfhydryl-reactive compounds (2-(trimethylammonium)ethyl)methanethiosulfonate (MTSET) and (2-sulfonatoethyl)methanethiosulfonate (MTSES) was determined for those residues with significant activity remaining. Three residues were essentially inactive when mutated to Cys: Asp(238), Pro(239), and Glu(247). Of the remaining residues, proteins with the mutations N227C, I233C, and L243C were strongly inhibited by MTSET, whereas amino acids Phe(230), Gly(231), Ala(236), Val(237), Ala(244), Val(245), and Glu(248) were partially inhibited by MTSET. MTSES did not affect the activity of the mutant NHE1 proteins. The structure of a peptide representing TM VI was determined using high resolution NMR spectroscopy in dodecylphosphocholine micelles. TM VI contains two helical regions oriented at an approximate right angle to each other (residues 229-236 and 239-250) surrounding a central unwound region. This structure bears a resemblance to TM IV of the Escherichia coli protein NhaA. The results demonstrate that TM VI of NHE1 is a discontinuous pore-lining helix with residues Asn(227), Ile(233), and Leu(243) lining the translocation pore.


Figures

FIGURE 1.
FIGURE 1.
Models of NHE1 isoform of the Na+/H+ exchanger. A, topological model of the transmembrane domain of the NHE1 isoform of the Na+/H+ exchanger based on cysteine accessibility studies (12). B, topological model of NHE1 based on comparison with crystal structure of bacterial homologue NhaA (13). C, schematic diagram of amino acids present in TM VI.
FIGURE 2.
FIGURE 2.
Analysis of wild type and mutant NHE1 proteins. A, Western blot of whole cell extracts of stable transfectants expressing Na+/H+ exchanger TM VI mutants or control proteins. All mutations were to cysteine. 75 μg of total protein was loaded in each lane. The numbers below the lanes indicate the mean values (n = 3–4) obtained from densitometric scans of both the 110 and 95 kDa bands relative to wild type NHE. AP-1, mock-transfected AP-1 cells. Wt and cNHE1, cells stably expressing wild type Na+/H+ exchanger protein and the cysteineless NHE1, respectively. *, significantly different from cNHE1 at p < 0.05. B, surface localization of cells expressing control and TM VI mutants, as described under “Experimental Procedures.” Equal amounts of total cell lysate (left lane) and unbound intracellular lysate (right lane) were examined by Western blotting with anti-HA antibody to identify NHE1 protein. cNHE1 Ct, a control experiment in which nonspecific binding to streptavidin-agarose beads was carried out following the standard procedure but without labeling cells with biotin. The percentage of the total NHE1 protein found on the plasma membrane is indicated for each mutant; calculations were based on the fully glycosylated protein only. For the control experiment, this indicates the amount of nonspecific binding to streptavidin-agarose beads. Results are the means ± S.E. (n ≥ 6 determinations. Autoradiography exposure times were increased for mutants expressing lower levels of protein. +, significantly different from that of cNHE1 at p < 0.01. C, summary of the rate of recovery from an acute acid load of AP-1 cells transfected with cNHE and TM VI Na+/H+ exchanger mutants. The mean activity of cNHE1 stably transfected with NHE1 was 0.01 ΔpH/s, and this value was set to 100%. Activities are a percentage of those of cNHE. Values are the mean ± S.E. (error bars) of 6–10 determinations. Results are shown for mean activity, both uncorrected (black) and normalized for surface processing (of glycosylated protein) and expression levels (gray). Mutants P239C and E247C were not corrected for surface targeting. *, mutants with uncorrected activity that is significantly different from that of cNHE1 at p < 0.001.
FIGURE 3.
FIGURE 3.
Effect of sulfhydryl-reactive compounds, MTSET and MTSES, on activity of cNHE1 and single cysteine NHE1 mutant-containing cell lines. A, example of results of the effect of MTSET or MTSES on activity of cNHE1 and I233C mutant. cNHE and I233C NHE1 protein activity was assayed in stably transfected AP-1 cells as described under “Experimental Procedures.” Activity was measured after two acid pulses. The first pulse in the absence of MTSET is shown. For ease of viewing, only the recovery from acidosis is shown for the second pulse, in which cells were treated with MTSES or MTSET. NH4Cl, treatment with ammonium chloride; Na Free, treatment with Na+-free buffer to induce acidosis; NaCl, recovery from acidosis in NaCl-containing buffer (for the second pulse, this contained MTSET/MTSES, and cells were pretreated with MTSET/MTSES for 10 min prior to NH4Cl-induced acid load). B, summary of results of mutant and control activities of TM VI mutants. Activity was measured after two ammonium chloride pulses as described under “Experimental Procedures.” The second acidification was after cells were treated with 10 mm reagent. Results are presented as the percentage of activity of the second acid load relative to the first. * or †, the second recovery from acid load was significantly lower than the first at p < 0.01 or p < 0.05, respectively. Solid filled bars, MTSET treatments; lightly shaded bars, MTSES treatments.
FIGURE 4.
FIGURE 4.
NMR structure of TMXI in DPC micelles. Shown is superimposition of structurally conserved regions of the TMVI peptide structure. Superimposition of the backbone atoms of the structurally conserved regions 228–238 (A) and 237–253 (B) is shown. The backbone is shown in black, and side chains are shown in color. C, views of a single ensemble member with MTSET-sensitive residues labeled shown from two sides.
FIGURE 5.
FIGURE 5.
Distance restraints maintaining the kinked structure of TM VI. The lowest energy ensemble member is shown in both a schematic diagram and a stick representation. Distance restraints to and from atoms in residues Val237 and Asp238 to other atoms are shown in black dotted lines.
FIGURE 6.
FIGURE 6.
Comparison of TM VI of NHE1 with TM IV of NhaA. A, region identified using the SEQSEE program (45) for the optimal pairwise alignment of the sequence of NHE1 TM VI against the entire NhaA sequence. B, alignment of the sequences of NHE1 TM VI and NhaA TM IV, as suggested by Landau et al. (13), with the extended regions highlighted. A vertical bar indicates amino acid identity. *, similar amino acids. MTSET-sensitive residues and the corresponding residues in NhaA are shown in boldface type. C, comparison of a representative NMR structure of TM VI of NHE1 (right) with that of TM IV of NhaA (left). Amino acids 223–253 of NHE1 and amino acids 121–143 of NhaA are shown. The conserved Asp residue and MSTET-sensitive residues in NHE1 and the corresponding residues in NhaA are labeled.
FIGURE 7.
FIGURE 7.
Paramagnetic relaxation enhancement rates for TM VI in DPC micelles. Backbone Hα PRE values are shown for TM VI. Higher PRE values represent a greater change in the measured T1 relaxation rates with respect to Mn2+ concentration and consequently represent regions of the peptide that are closer to the surface of the detergent micelle that are more accessible to the water-soluble Mn2+ ions.

References

    1. Karmazyn M., Sawyer M., Fliegel L. (2005) Curr. Drug Targets Cardiovasc. Haematol. Disord. 5, 323–335 - PubMed
    1. Fliegel L. (2009) Expert Opin. Ther. Targets 13, 55–68 - PubMed
    1. Slepkov E. R., Rainey J. K., Sykes B. D., Fliegel L. (2007) Biochem. J. 401, 623–633 - PMC - PubMed
    1. Grinstein S., Rotin D., Mason M. J. (1989) Biochim. Biophys. Acta 988, 73–97 - PubMed
    1. Shrode L., Cabado A., Goss G., Grinstein S. (1996) in The Na+/H+ Exchanger (Fliegel L. ed) pp. 101–122, R.G. Landes Co., Austin, TX

Publication types

MeSH terms

Associated data

LinkOut - more resources