. 2010 Oct;137(20):3449-58.
doi: 10.1242/dev.045310. Epub 2010 Sep 15.

Integrin alphaV is necessary for gastrulation movements that regulate vertebrate body asymmetry

Affiliations

Integrin alphaV is necessary for gastrulation movements that regulate vertebrate body asymmetry

Ararat J Ablooglu et al. Development. 2010 Oct.

Abstract

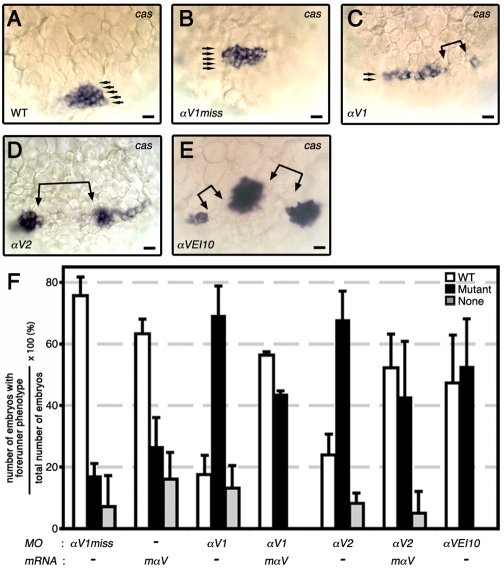
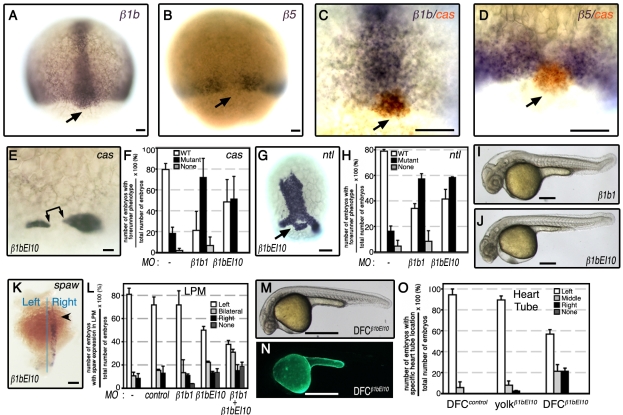
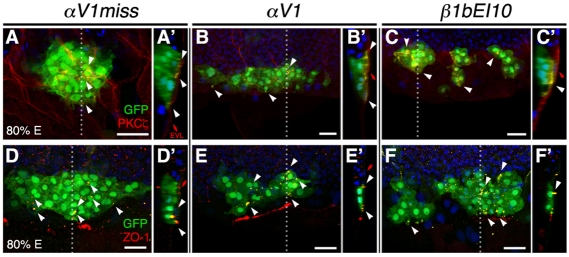
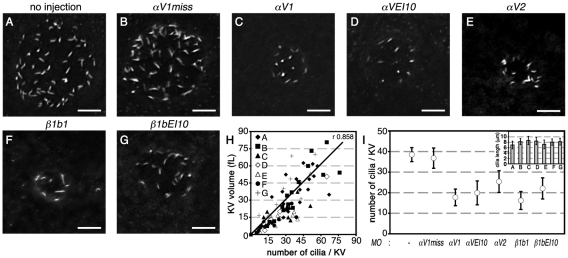
Integrin αV can form heterodimers with several β subunits to mediate cell-cell and cell-extracellular matrix interactions. During zebrafish gastrulation, αV is expressed maternally and zygotically. Here, we used a morpholino-mediated αV knockdown strategy to study αV function. Although αV morphants displayed vascular defects, they also exhibited left-right body asymmetry defects affecting multiple visceral organs. This was preceded by mislocalization of dorsal forerunner cells (DFCs) and malformation of the Kupffer's vesicle (KV) laterality organ. These defects were rescued with morpholino-resistant αV mRNA. Like αV, integrin β1b was expressed in DFCs, and β1b knockdown largely recapitulated the laterality phenotype of αV morphants. When tracked in real-time, individual DFCs of both morphants showed defects in DFC migration, preventing them from organizing into a KV of normal shape and size. Thus, we propose that αVβ1b mediates cellular interactions that are necessary for DFC clustering and movements necessary for Kupffer's vesicle formation, uncovering an early contribution of integrins to the regulation of vertebrate laterality.


Figures

Fig. 1.
Fig. 1.
Integrin αV knockdown perturbs proper heart tube asymmetry in zebrafish embryos. (A-D) Dorsal views of 28 hours post-fertilization (hpf) embryos hybridized with a probe to cmlc2 to determine heart tube location. Scale bars: 100 μm. (A) Embryo injected with standard control MO. (B-D) Embryos injected with αV1. (E) Bar graphs showing effects of αV integrin loss of function on heart tube location. Data expressed as number of embryos with cmlc2 expression location divided by total number of embryos used per experiment × 100 (%) ± s.e.m. See also Table S1 in the supplementary material.
Fig. 2.
Fig. 2.
Integrin αV mRNA is a maternal factor and its specific knockdown in DFCs alters heart tube asymmetry. (A-C) WISH analysis in wild-type zebrafish embryos shows maternal expression of αV at the 4-cell stage (A) and sphere stage (4 hpf; B), and zygotic expression at 60-80% epiboly (E). (D-L) Lateral views of live embryos at 32 hpf (D-H) or 28 hpf (I-L). When integrin αV morpholinos (MOs) were delivered at the 1- to 4-cell stage, morphants developed hydrocephaly in the fourth ventricle (black arrowheads) that was also associated with formation of abnormal cerebellum. Control (D) and αV1miss (E) morphants had wild-type head phenotype. Insets in panels D to H represent ∼55 hpf head phenotype of respective morphants. Note intracerebral bleeding (pink color behind eyes) at 55 hpf. When control or αV1 MOs were injected into yolk at mid-blastula stage (512-1000 cells), which targets DFCs specifically, these animals had wild-type phenotype (I,J). (K,L) Fluorescence images corresponding to I and J, revealing that MOs were exclusively present in the yolk cell. (M) Bar graph showing the effects of αV integrin loss-of-function specifically in DFCs on heart tube location. Data expressed are similar to those in Fig. 1E. Scale bars: 100 μm in A-C; 500 μm in D-L. See also Table S3 in the supplementary material.
Fig. 3.
Fig. 3.
Migratory DFCs are not properly formed in αV morphants. (A-E) Dorsal views of MO-injected embryos were slightly tilted to visualize cas expression (arrows, black) in DFCs at 80% E. Gaps in DFC field are indicated with bracketed arrows. (F) Bar graph showing scores from DFC phenotypes. Phenotypic classification of DFCs were as follows: Wild-type (WT), ovoid DFC cluster; mutant, a linear array of DFCs with occasional gaps; none, no visible DFCs. Data expressed are similar to those in Fig. 1E. Scale bars: 20 μm. See also Table S4 in the supplementary material.
Fig. 4.
Fig. 4.
Integrin β1b morphants phenocopy the organ asymmetry defects of αV morphants. (A,B) Dorsal views of wild-type embryos at 80% E, hybridized with a probe to β1b and β5. Putative DFCs are positive for β1b transcripts (black arrow; A), and β5 transcripts are present in the marginal cells where there is a gap in this expression field (black arrow, B). (C,D) Double WISH samples showing simultaneous expression of cas (red orange) and β1b (dark purple; C); or cas (red orange) and β5 (dark purple; D). (E-H) Dorsal views of embryos, slightly tilted to visualize cas (E) and ntl (G) expression in DFCs. Delivery of β1b MOs to 1- to 4-cell-stage embryos caused improper formation of forerunner cell cluster, assessed by cas (E) and ntl (G) expression in DFCs at 80% E. DFCs in β1b morphants had occasional gaps and were separated from the axis (black arrow in G). (F,H) Bar graphs summarize DFC phenotypes using cas or ntl as markers. Phenotypic classification of DFCs and data analyses were similar to those in Fig. 3. (I,J) β1b morphants developed undulated tail and abnormal head phenotype, which were evident at 32 hpf. (K) spaw expression in β1b morphants in lateral plate mesoderm (LPM) in 15-17 somite stage (SS) embryos. Dorsal view of a representative β1bEI10 morphant (5 ng) showing right-sided spaw in LPM (arrowhead). (L) Bar graph showing the effects of β1b integrin loss-of-function on localization of spaw expression. (M) When β1bEI10 was injected into yolk at mid-blastula stage (512-1000 cells), animals had wild-type phenotype. (N) A representative fluorescence image corresponding to M that shows MO presence only in the yolk cell. (O) Bar graph showing effects of β1b integrin loss selectively in DFCs on heart tube location. Data expressed are similar to those in Fig. 1E. Scale bars: 50 μm in A-D; 20 μm in E; 100 μm in G,K; 500 μm in I,J,M,N.
Fig. 5.
Fig. 5.
Effects of integrin αV1 or β1b knockdown on DFC orientation, shape and protrusive activity. At mid-gastrulation stages, DFCs show dynamic cellular protrusive activity and only control DFCs are normally mediolaterally oriented and have elongated morphology. (A-C) Dorsal views of Tg(sox17:GFP)-expressing embryos. Time-lapse images of migratory DFCs were collected by confocal microscopy at mid-gastrulation and migration was highlighted with pseudo-colors at one-minute intervals at the DFC cluster edge. Pseudo-colored outlines show the edges of DFC clusters at the timepoints indicated on the right. (A) At 70% E, all DFCs were clustered in αV1miss control embryos (1.75 ng; n=10) and remained clustered until the end of gastrulation (see also Movie 1 in the supplementary material). (B) Some DFCs in αV1 morphants (1.25 ng; n=6) formed clusters (white rectangles). Later in development, cells outside of these clusters detached from each other (see also Movie 3 in the supplementary material). (C) β1bEI10 (5 ng; n=6) morphants had multiple DFC clusters (see also Movie 5 in the supplementary material). (D-F) Pseudopod-like protrusion behavior of representative DFC cluster edges is shown between 4 to 5 minutes. Vectors illustrate the relative protrusion velocities of cells at the cluster edge and the direction of protrusions. Each vector represents a protrusion event, where its speed is proportional to the vector length. (D) Protrusions in αV1miss morphant DFCs formed towards the vegetal pole, whereas DFC protrusions in αV1 (E) and β1bEI10 morphants (F) lost their directionality. The relative locations of αV1 morphant DFCs that did not form any clusters, or detached from each other later in development, are highlighted with dotted lines (E). (G-I) Representative ∼3 μm thick focal plane confocal images of Tg(sox17:GFP)-expressing DFC clusters. Dorsal views of 80% E embryos are shown in all panels, anterior to the top. Half-rose diagrams show the angular distribution of the long axis of individual DFCs with respect to anterior-posterior (a,p) axis. Red arrows indicate the orientation of the long axis in each individual DFC that showed clear cellular boundary at these representative focal planes. Dividing DFCs (asterisks) were excluded from these measurements. ml, mediolateral axis. (J) The length (L) and width (W) measurements of individual DFCs were used to establish L-W ratios ± s.e.m. The majority of control αV1miss-injected embryos had a L-W ratio of 2.00, represented with ellipsoid cell shape. However, the L-W ratio in a significant fraction of morphant DFCs was close to 1.00, represented with circular cell shape. Total number of embryos and DFCs scored to determine individual cell orientation, length and width (L/W) ratios: 1.5 ng αV1miss (n=11, 251 DFCs); 1.25 ng αV1 (n=11, 218 DFCs); 5 ng β1bEI10 (n=11, 186 DFCs). (K) Average number of new and discrete large protrusions developed per DFC per hour were manually counted from the time-lapse confocal microscopy of migratory DFCs. DFC cluster edge in an αV1miss-injected embryo (see Movie 1 in the supplementary material) is outlined and a representative large protrusion is highlighted in red. The behavior and life span of the protrusions are shown below from 0-5 minutes. The bar graph shows the effects of αV and β1b knockdown on the number of protrusions formed per DFC per embryo per hour ± s.e.m. Total number of embryos studied: 1.5 ng αV1miss (n=5); 1.25 ng αV1 (n=3); 5 ng β1bEI10 (n=3). Scale bars: 50 μm in A-F; 20 μm G-I,K.
Fig. 6.
Fig. 6.
Apical attachment of DFC to EVL is maintained in αV and β1b morphants. (A-F') Confocal images of DFCs in Tg(sox17:GFP)-expressing embryos (green) nuclear-stained (blue) and immunolabeled with anti-aPKC-ζ antibody (red) (A-C) or with anti-ZO-1 antibody (red) (D-F); channels are merged. Dorsal views of 80% E embryos are shown in all panels, anterior to the top. Sagittal confocal sections at the position of the dotted lines are shown in A′ to F′, embryo surface to the right. Representative embryos that were injected with 1.5 ng αV1miss (A,D), 1.25 ng αV1 (B,E), or 5 ng β1bEI10 (C,F). (A-C) 3D rendering of multiple focal planes through the embryo at the level of DFCs. At 80% E, aPKC-ζ staining demarcates the DFC-EVL interface (A′-C′, white arrowheads). (D-F) Single dorsal focal planes of DFC clusters. Embryos were immunolabeled with ZO-1, which was enriched between DFCs and the interior surface of overlying EVL (D-F′, white arrowheads). Scale bars: 30 μm.
Fig. 7.
Fig. 7.
αV and β1b knockdown disrupts physical properties of Kupffer's vesicle. (A-G) Dorsal views of 6-8 SS embryos; confocal images of Kupffer's vesicle (KV) cilia were detected by a fluorescent anti-acetylated tubulin antibody. Shown is a 3D rendering of multiple focal planes through the embryo at the level of KV. Total number of embryos used to determine number of cilia per KV and cilia length per morphant: uninjected (n=19); 1.75 ng αV1miss (n=16); 1.25 ng αV1 (n=12); 5 ng αVEI10 (n=9); 1.75 ng αV2 (n=9); 1.0 ng β1b1 (n=8); 5 ng β1bEI10 (n=10). Scale bars: 20 μm. (H) Graphic representation of KV volume versus cilia number per KV. (I) Graphic representation of the number of cilia per KV in control and knockdown embryos. Inset, cilia length in αV and β1b morphants, indicated with their respective panel labels A to G. Data represent mean ± s.e.m.
Fig. 8.
Fig. 8.
KV lumen does not properly form in αV and β1b morphants. Confocal images of Tg(sox17:GFP)-expressing embryos (green) are shown. (A-C,G-I) Single focal planes at the center of the DFC cluster immunolabeled with anti-ZO-1 antibody (red; A-C) or anti-aPKC-ζ antibody (red) and anti-acetylated tubulin antibody (white; G-I). (D-F) 3D renderings of anti-ZO-1 labeled embryos of A-C. Dorsal views of 6-8 SS embryos are shown in all panels, anterior to the top. Embryos injected with αV1miss control MO developed a large fluid-filled lumen (A,G) that had a uniform ZO-1-labeled tight junction lattice within the DFC-derived lining of the KV (D). However, in αV (B,H) and β1b (C,I) morphants, DFCs did not aggregate properly, yielding a dysmorphic ZO-1 lattice (E,F). Anti-aPKCζ staining shows that KV cells in αV1miss morphants were polarized (G), but not in αV (H) and β1b morphants (I). Scale bars: 30 μm.

References

    1. Ablooglu A. J., Kang J., Handin R. I., Traver D., Shattil S. J. (2007). The zebrafish vitronectin receptor: characterization of integrin alphaV and beta3 expression patterns in early vertebrate development. Dev. Dyn. 236, 2268-2276 - PubMed
    1. Abrams E. W., Mullins M. C. (2009). Early zebrafish development: it's in the maternal genes. Curr. Opin. Genet. Dev. 19, 396-403 - PMC - PubMed
    1. Alexander J., Stainier D. Y. (1999). A molecular pathway leading to endoderm formation in zebrafish. Curr. Biol. 9, 1147-1157 - PubMed
    1. Amack J. D., Yost H. J. (2004). The T box transcription factor no tail in ciliated cells controls zebrafish left-right asymmetry. Curr. Biol. 14, 685-690 - PubMed
    1. Amack J. D., Wang X., Yost H. J. (2007). Two T-box genes play independent and cooperative roles to regulate morphogenesis of ciliated Kupffer's vesicle in zebrafish. Dev. Biol. 310, 196-210 - PubMed

Publication types