. 2010 Nov 1;21(21):3630-8.
doi: 10.1091/mbc.E10-04-0312. Epub 2010 Sep 15.

Adenomatous polyposis coli and hypoxia-inducible factor-1{alpha} have an antagonistic connection

Affiliations

Adenomatous polyposis coli and hypoxia-inducible factor-1{alpha} have an antagonistic connection

Ian P Newton et al. Mol Biol Cell. .

Abstract

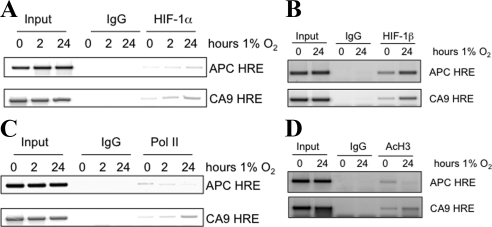
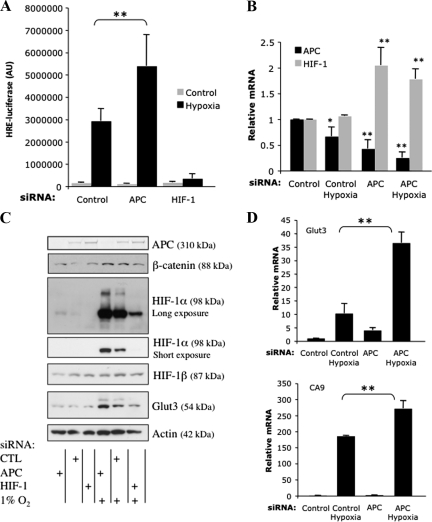
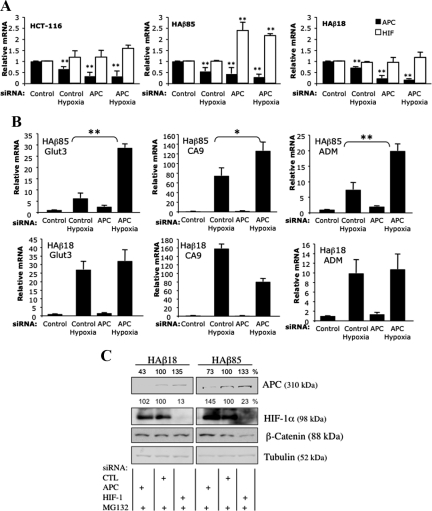
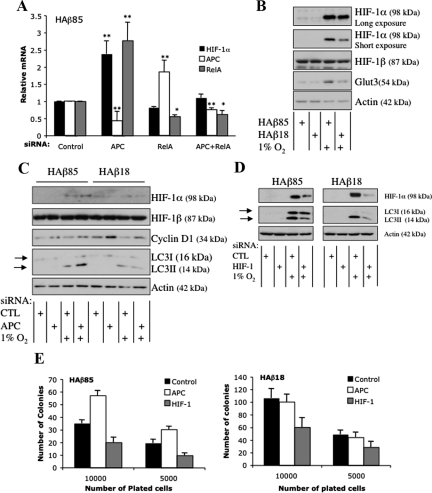
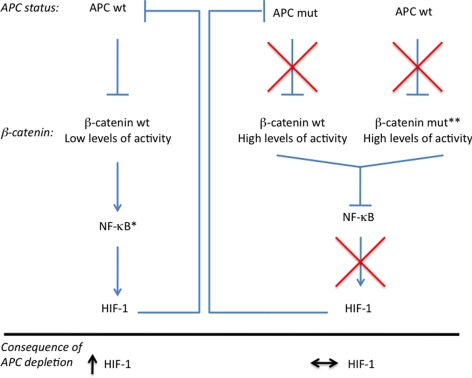
The tumor suppressor adenomatous polyposis coli (APC) is mutated in the majority of colorectal cancers and is best known for its role as a scaffold in a Wnt-regulated protein complex that determines the availability of β-catenin. Another common feature of solid tumors is the presence of hypoxia as indicated by the up-regulation of hypoxia-inducible factors (HIFs) such as HIF-1α. Here, we demonstrate a novel link between APC and hypoxia and show that APC and HIF-1α antagonize each other. Hypoxia results in reduced levels of APC mRNA and protein via a HIF-1α-dependent mechanism. HIF-1α represses the APC gene via a functional hypoxia-responsive element on the APC promoter. In contrast, APC-mediated repression of HIF-1α requires wild-type APC, low levels of β-catenin, and nuclear factor-κB activity. These results reveal down-regulation of APC as a new mechanism that contributes to the survival advantage induced by hypoxia and also show that loss of APC mutations produces a survival advantage by mimicking hypoxic conditions.


Figures

Figure 1.
Figure 1.
HIF-1α represses APC gene expression. (A) U2OS, HCT-116. Haβ18, Haβ85, SW480, and DLD-1 cells were exposed to 1% O2 for 24 h before harvest. Whole cell lysates were analyzed by immunoblot blot using the indicated antibodies. (B) U2OS cells were exposed to 1% O2 for the indicated periods before total RNA or whole cell lysates extraction. RT-qPCR for APC was performed with actin as a reference. The graph depicts the mean plus SD of a minimum of three independent experiments performed in duplicate. Whole cell lysates were analyzed by immunoblot blot using the indicated antibodies. (C) U20S, HCT-116, and HAβ18 cells were transfected with control and HIF-1α siRNA oligonucleotides (a and b) for 48 h before total RNA extraction. RT-qPCR for APC and HIF-1α was performed with actin as a reference gene. The graph depicts the mean plus SD of a minimum of three independent experiments performed in duplicate. (D) U2OS cells were transfected with control, APC, and HIF-1α siRNA oligonucleotides for 48 h. Cells were exposed to 1% O2 for 24 h before harvest. Whole cell lysates were analyzed by Western blot using the indicated antibodies. Asterisk (*) indicates the level of significance. *p < 0.05, **p < 0.01, and ***p < 0.005.
Figure 2.
Figure 2.
APC is a direct HIF-1α target. (A) ChIP analysis for HIF-1α binding to the APC and CA9 promoters. U2OS cells were exposed to 1% O2 for the indicated periods before fixation and lysis. HIF-1α-bound DNA was amplified with specific primers spanning the annotated HRE region on the CA9 and the putative HRE at the APC promoter. Rabbit immunoglobulin G (IgG) was used as a control for the immunoprecipitation. Input represents 10% of the starting material used per immunoprecipitation (IP). (B) ChIP analysis for HIF-1β binding at the APC and CA9 promoters. U2OS cells were exposed to 1% O2 for 24 h before fixation and lysis. HIF-1β–bound DNA was amplified with specific primers spanning the annotated HRE region on the CA9 and the putative HRE at the APC promoter. Rabbit IgG was used as a control for the immunoprecipitation. Input represents 10% of the starting material used per IP. (C) ChIP for AcH3. (D) Polymerase II at the APC HRE site. Cells were treated and processed as described in B. Rabbit IgG was used as a negative control. APC HRE site was amplified using specific PCR primers. Inputs represent 10% of starting material used in each IP.
Figure 3.
Figure 3.
APC depletion increases HIF-1 levels and activity. (A) U2OS-HRE luciferase cells were transfected with the indicated siRNA oligonucleotides. Where indicated, cells were exposed to 1% O2 for 24 h before harvest. Luciferase activity was analyzed 48 h posttransfection. Graph depicts the mean plus SD of a minimum of two independent experiments performed in duplicate. (B) U2OS cells were transfected with control and APC siRNA oligonucleotides for 48 h before total RNA extraction. Where indicated, cells were exposed to 1% O2 for 24 h. After cDNA synthesis, qPCR was performed for APC and HIF-1α mRNA. Levels were normalized to actin mRNA, and the graph depicts the mean plus SD of a minimum of three independent experiments performed in duplicate. (C) U2OS cells were transfected with siRNA oligonucleotides as indicated and exposed or not to 1% O2 for 24 h before harvest. Whole cell lysates were analyzed by Western blot to detect the levels of APC, HIF-1α, and the HIF-1α target Glut3. Actin and HIF-1β were used as loading controls. (D) U2OS cells were treated as described in B, and qPCR was performed for the HIF-1α target genes as indicated. Asterisk (*) indicates the level of significance. *p < 0.05, **p < 0.01, and ***p < 0.005.
Figure 4.
Figure 4.
Depletion of APC increases HIF-1α activity in situ. (A) CA9 staining of wild-type (WT) and APC-depleted mouse small intestine. Maximum intensity projections of widefield, deconvolved images show cortical localization of CA9 in crypts from WT tissue (arrowhead), except in Paneth cells at the base of the crypt, which show little or no staining. APC-depleted cells toward the base of the crypt/villus axis (arrow) form a disorganized epithelium and elevated CA9 homogenously in the cytoplasm. Because Cre-activation and thus APC depletion only occurs in the proliferative compartment of the crypt, the same tissue section also shows cells toward the tip of the villus (arrowhead) that are wild type for APC, and, like control tissue, show only weak staining for CA9. Bars, 20 μm. (B) SW480 and DLD-1 cells were transfected with control and APC siRNA oligonucleotides and treated where indicated with 50 μM MG132 for 3 h before harvest. Whole cell lysates were analyzed by Western blot using the indicated antibodies.
Figure 5.
Figure 5.
Increased HIF-1α after APC depletion requires wild-type β-catenin. (A) HCT-116 (parental, mutant, and wild-type β-catenin), HAβ85 (wild-type β-catenin), and HAβ18 (mutant β-catenin) were transfected with control or APC siRNA oligonucleotides for 48 h before RNA extraction and exposed or not to 1% O2 for 24 h. RT-qPCR was performed for APC and HIF-1α, with actin used as a normalizing gene. The graph depicts mean plus SD of a minimum of three independent experiments performed in duplicate. (B) HAβ85 (wild-type β-catenin) and HAβ18 (mutant β-catenin) were transfected with control or APC siRNA oligonucleotides for 48 h before RNA extraction and exposed or not to 1% O2 for 24 h. RT-qPCR was performed for the indicated HIF-1α target genes. The graph depicts mean plus SD of a minimum of three independent experiments performed in duplicate. Asterisk (*) indicates the level of significance. *p < 0.05, **p < 0.01, and ***p < 0.005. (C) HAβ85 (wild-type β-catenin) and HAβ18 (mutant β-catenin) were transfected with control, APC, or HIF-1α siRNA oligonucleotides and treated where indicated with 50 μM MG132 for 3 h before harvest. Whole cell lysates were analyzed by immunoblot using the indicated antibodies. ImageJ software was used to quantify band intensity.
Figure 6.
Figure 6.
Increased HIF-1α after APC depletion requires NF-κB. (A) HAβ85 cells were transfected with the indicated siRNA oligonucleotides for 48 h before RNA extraction. Where indicated, cells were exposed to 1% O2 for 24 h. RT-qPCR was performed for the levels of HIF-1α, RelA, and APC, with actin used as normalizing gene. Graph depicts the mean plus SD of a minimum of three independent experiments performed in duplicate. (B) HAβ85 and HAβ18 cells were treated with 1% O2 for 24 h before lysis. Whole cell lysates were analyzed by immunoblot for the levels of the indicated proteins. (C) HAβ85 and HAβ18 cells transfected with control and APC siRNA oligonucleotides for 48 h. Cells were exposed to 1% O2 for 24 h before harvest. Whole cell lysates were analyzed by Western blot using the indicated antibodies. Arrows indicate LC3I and LC3II. (D) HAβ85 and HAβ18 cells transfected with control and HIF-1α siRNA oligonucleotides for 48 h. Cells were exposed to 1% O2 for 24 h before harvest. Whole cell lysates were analyzed by Western blot using the indicated antibodies. Arrows indicate LC3I and LC3II. (E) Survival effects of APC and HIF-1α depletion in HAβ85 and HAβ18 cells. Cells were transfected with siRNA oligonucleotides for APC and HIF-1α as indicated. 24 h posttransfection, cells were counted and the indicated number of cells were plated and allowed to grow for additional 7 d before fixation and crystal violet staining. Plates were scanned and ImageJ software was used to count colonies.
Figure 7.
Figure 7.
Summary diagram of key findings. HIF-1α represses the APC gene directly. APC-mediated repression of HIF-1α is indirect and requires wild-type APC, low levels of β-catenin, and NF-κB activity. *, low levels of β-catenin allow for NF-κB activity and hence are not repressed. **, mutations in β-catenin make this protein nondegradable and thus constitutively active. High levels of β-catenin prevent NF-κB activation.

References

    1. Anderson L. A., Perkins N. D. Regulation of RelA (p65) function by the large subunit of replication factor C. Mol. Cell Biol. 2003;23:721–732. - PMC - PubMed
    1. Bardos J. I., Ashcroft M. Negative and positive regulation of HIF-1, a complex network. Biochim. Biophys. Acta. 2005;1755:107–120. - PubMed
    1. Bardos J. I., Chau N. M., Ashcroft M. Growth factor-mediated induction of HDM2 positively regulates hypoxia-inducible factor 1alpha expression. Mol. Cell Biol. 2004;24:2905–2914. - PMC - PubMed
    1. Bienz M., Clevers H. Linking colorectal cancer to Wnt signaling. Cell. 2000;103:311–320. - PubMed
    1. Brabletz T., Jung A., Reu S., Porzner M., Hlubek F., Kunz-Schughart L. A., Knuechel R., Kirchner T. Variable beta-catenin expression in colorectal cancers indicates tumor progression driven by the tumor environment. Proc. Natl. Acad. Sci. USA. 2001;98:10356–10361. - PMC - PubMed

Publication types

MeSH terms

LinkOut - more resources