Comparative Study
. 2010 Sep 15;30(37):12480-94.
doi: 10.1523/JNEUROSCI.1780-10.2010.

Neural correlates of auditory scene analysis based on inharmonicity in monkey primary auditory cortex

Affiliations
Comparative Study

Neural correlates of auditory scene analysis based on inharmonicity in monkey primary auditory cortex

Yonatan I Fishman et al. J Neurosci. .

Abstract

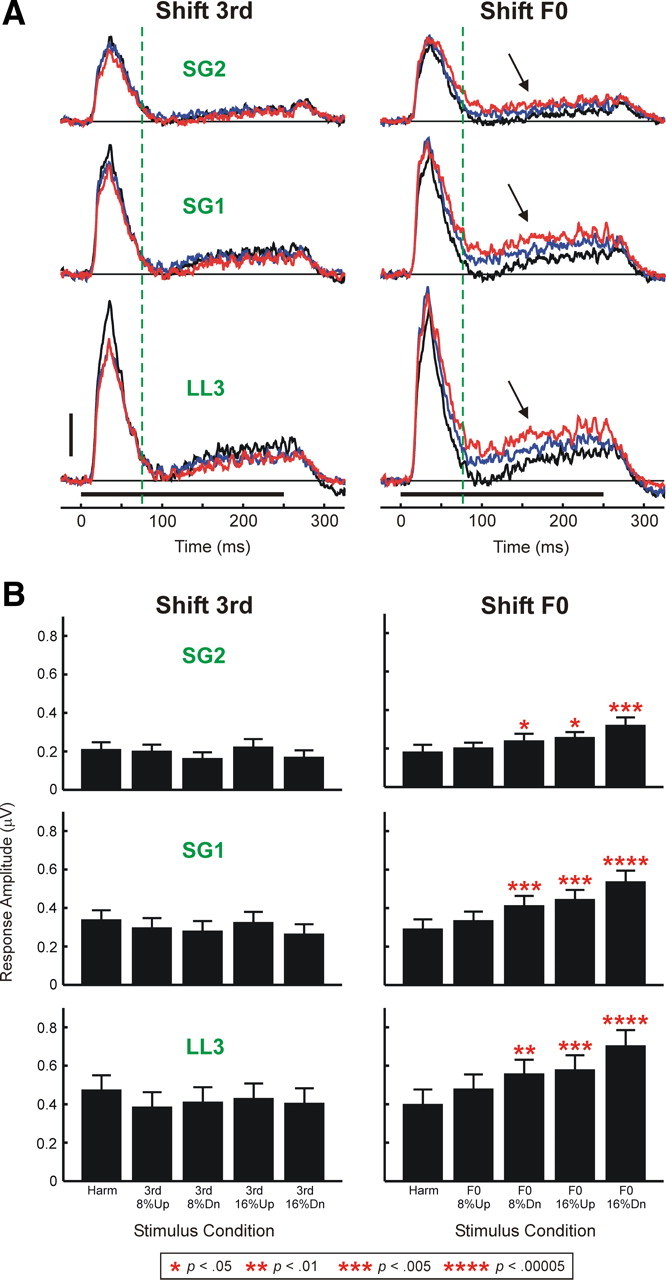
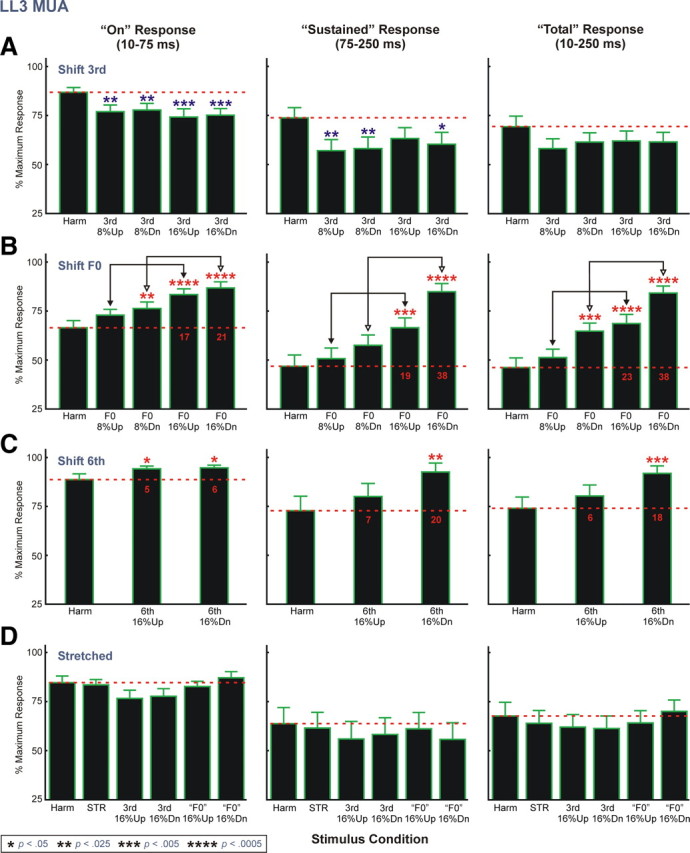
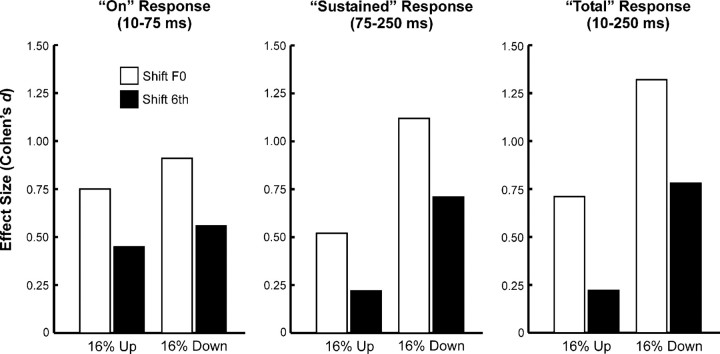
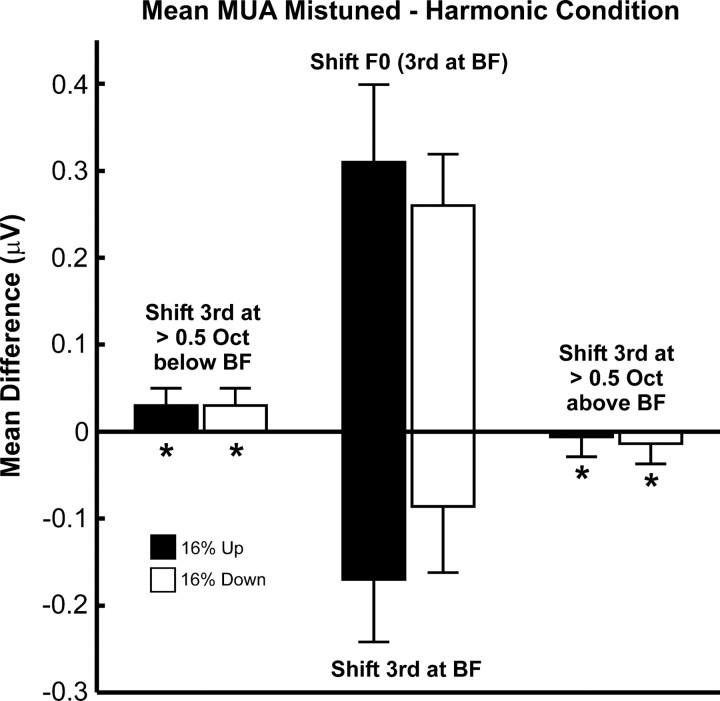
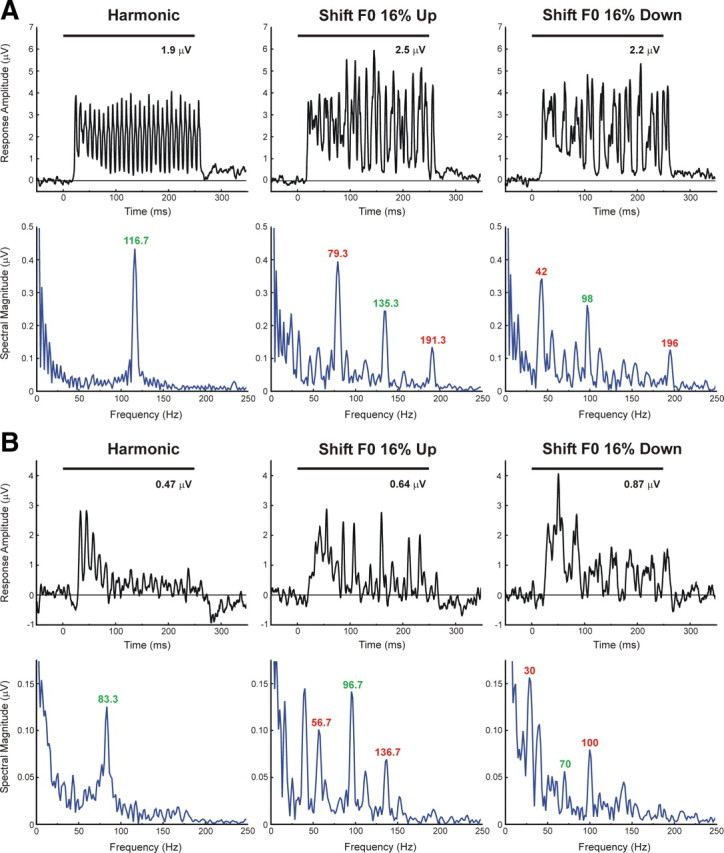
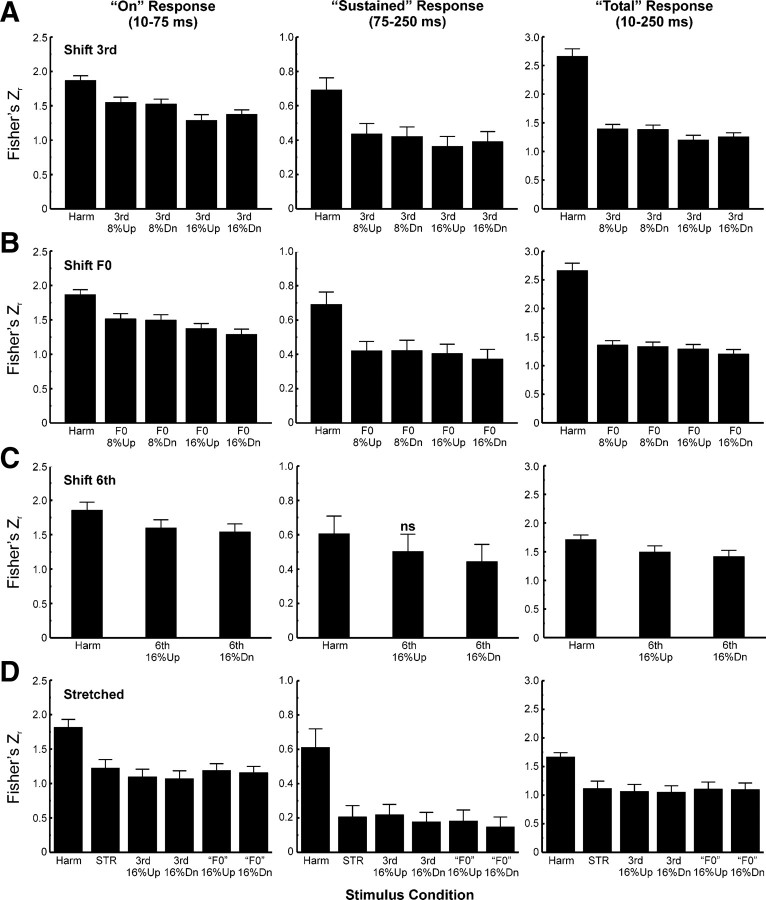
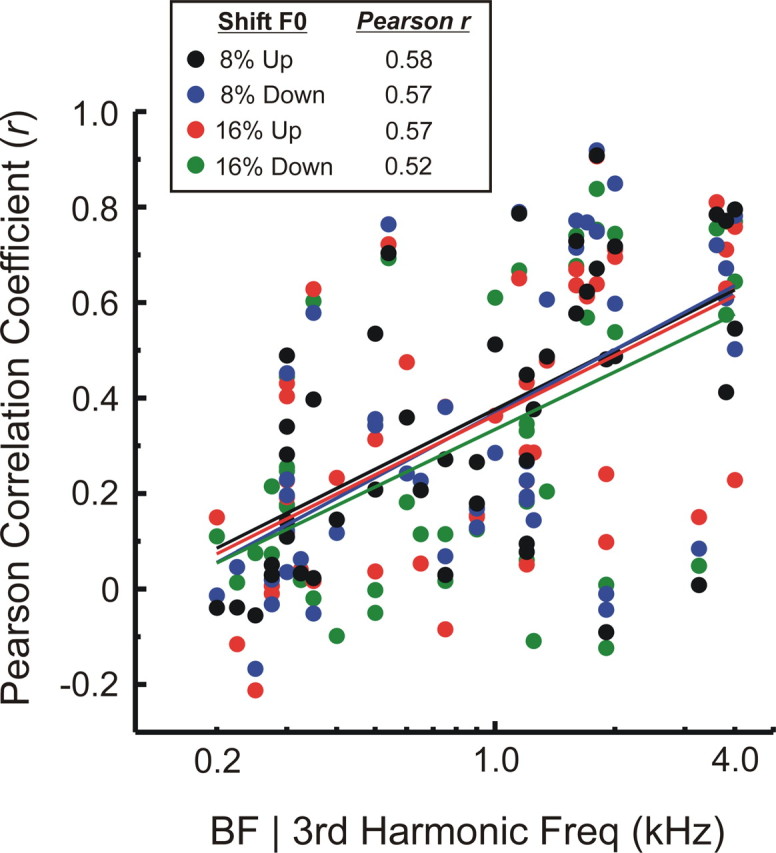
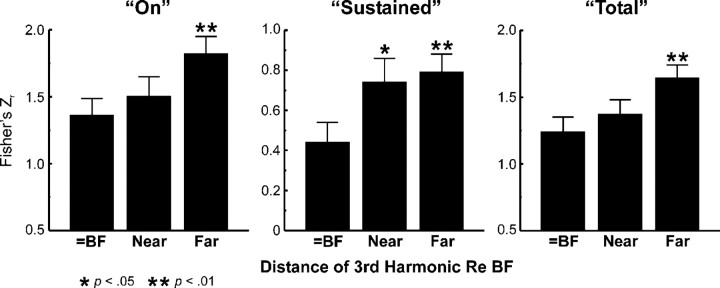
Segregation of concurrent sounds in complex acoustic environments is a fundamental feature of auditory scene analysis. A powerful cue used by the auditory system to segregate concurrent sounds, such as speakers' voices at a cocktail party, is inharmonicity. This can be demonstrated when a component of a harmonic complex tone is perceived as a separate tone "popping out" from the complex as a whole when it is sufficiently mistuned from its harmonic value. The neural bases of perceptual "pop out" of mistuned harmonics are unclear. We recorded multiunit activity from primary auditory cortex (A1) of behaving monkeys elicited by harmonic complex tones that were either "in tune" or that contained a mistuned third harmonic set at the best frequency of the neural populations. Responses to mistuned sounds were enhanced relative to responses to "in-tune" sounds, thus correlating with the enhanced perceptual salience of the mistuned component. Consistent with human psychophysics of "pop out," response enhancements increased with the degree of mistuning, were maximal for neural populations tuned to the frequency of the mistuned component, and were not observed under comparable stimulus conditions that do not elicit perceptual "pop out." Mistuning was also associated with changes in neuronal temporal response patterns phase locked to "beats" in the stimuli. Intracortical auditory evoked potentials paralleled noninvasive neurophysiological correlates of perceptual "pop out" in humans, further augmenting the translational relevance of the results. Findings suggest two complementary neural mechanisms for "pop out," based on the detection of local differences in activation level or coherence of temporal response patterns across A1.


Figures

Figure 1.
Figure 1.
Spectra of complex sound stimuli presented in the study. Frequency and stimulus conditions are represented along the ordinate and abscissa, respectively. Spectral components of the complex sounds are schematically represented by square symbols. Stimuli were presented in four blocks: “shift 3rd,” “shift F0,” “shift 6th,” and “stretched.” Each block consisted of an “in-tune” harmonic condition and several mistuned conditions in which stimuli were made inharmonic via various manipulations. Stimuli were designed so that the third component under the harmonic condition (Harm) was set equal to the BF of the site (the peak of its FRF, schematically shown at the left of the figure; in the case depicted, the BF and third harmonic = 750 Hz, indicated by the dashed horizontal line, and the F0 = 250 Hz). Components shifted upward (Up) or downward (Dn) relative to their frequency under the harmonic condition are represented by filled symbols. Arrows in the “shift 6th” panel indicate stimulus components that are visually occluded by the adjacent mistuned components due to their close proximity in frequency.
Figure 2.
Figure 2.
Mean FRF of LL3 MUA averaged across the 46 sites in A1 examined in the study. At each site, MUA evoked by tones was averaged within a time window of 10–250 ms after stimulus onset and then normalized to the amplitude of the largest tone-evoked response. Normalized FRF values were then binned in quarter-octave steps above and below the BF at each site and averaged across sites. Error bars represent SEM.
Figure 3.
Figure 3.
Representative laminar response profiles evoked by harmonic and mistuned stimuli in A1. Responses evoked by harmonic, “shift F0” 16% up, and “shift F0” 16% down stimuli are plotted in black, blue, and red, respectively. AEPs (left column) and MUA (right column) are recorded by a multicontact electrode that enables sampling of activity at 16 laminar depths simultaneously in each electrode penetration (schematic of the electrode is shown on the left; intercontact distance = 150 μm). Approximate laminar boundaries are indicated on the right of the figure. One-dimensional CSD profiles (center column) are derived from the AEP profiles. The frequency of the third harmonic remained fixed at the BF of the site (1000 Hz) under all stimulus conditions. Duration of stimuli is represented by the black horizontal bar above the time axes. Calibration bars indicate response amplitudes. Response components examined in the study are labeled in green. MUA was examined at three depths sampled by electrode contacts positioned within lower lamina 3 (LL3) and at two adjacent supragranular locations (SG1 and SG2). At each of these depths, MUA was analyzed within three time windows, which included the “on” (10–75 ms), “sustained” (75–250 ms), and “total” (10–250 ms) portions of the response, as enclosed by the rectangles superimposed on the MUA waveforms. PSTHs based on multiunit spike activity within LL3 were also analyzed.
Figure 4.
Figure 4.
Lower lamina 3 MUA evoked at two sites (A, B) by harmonic and mistuned stimuli. MUA evoked under “shift 3rd” and “shift F0” conditions is plotted in the top and bottom row of each panel, as indicated. Responses to harmonic stimuli are plotted in black; responses to stimuli mistuned via upward and downward shifts of 16% are plotted in blue and red, respectively (responses to stimuli with 8% shifts are omitted for clarity). Stimulus duration is represented by the black horizontal bar above the waveforms. FRFs of the sites (based on MUA integrated over the “total” 10–250 ms time window) are shown in the center column and spectra of the stimuli are represented by the superimposed round symbols (top-to-bottom order: harmonic, shift 16% up, shift 16% down). Symbols filled blue and red denote components shifted upward and downward in frequency, respectively, relative to the harmonic condition. The dashed vertical line indicates the BF of the site (A, 1000 Hz; B, 650 Hz). Responses at each site under each stimulus condition are quantified by averaging the MUA within the 10–250 ms time window; average MUA is then normalized to the maximal average MUA evoked within each stimulus block (bar graphs in right column; see Materials and Methods and Fig. 1 for description of stimulus blocks). The red horizontal dashed line superimposed on the graphs indicates the normalized response amplitude under the harmonic condition.
Figure 5.
Figure 5.
A, Waveforms of MUA evoked by harmonic and mistuned stimuli averaged across all 46 electrode penetrations into A1. Mean MUA evoked by harmonic stimuli is plotted in black; responses to stimuli mistuned via upward and downward shifts of 16% are plotted in blue and red, respectively (responses to stimuli with 8% shifts are omitted for clarity). Stimulus duration is represented by the black horizontal bar above the time axes. Mean waveforms of MUA evoked under “shift 3rd” and “shift F0” conditions are plotted in the left and right columns, respectively. Mean MUA recorded in LL3 and at more superficial cortical depths (SG1 and SG2) is plotted in separate rows, as indicated. Vertical dashed green lines mark the boundary between “on” and “sustained” portions of responses analyzed in the study. Black arrows indicate enhanced “sustained” responses to mistuned stimuli under the “shift F0” condition. Height of the vertical calibration bar represents 0.5 μV. B, Mean MUA integrated over the “total” response window and averaged across the 46 electrode penetrations. The layout is the same as in A. Error bars represent SEM. Statistically significant (p < 0.05) increases in MUA amplitude under mistuned conditions relative to the harmonic condition are indicated by red asterisks placed above the bars. The p value associated with each of the planned one-tailed paired t tests comparing MUA amplitudes under mistuned and harmonic conditions is represented by the number of asterisks, as identified in the legend at the bottom of the figure. Significant mistuning-related response enhancements are observed only under the “shift F0” condition.
Figure 6.
Figure 6.
Normalized LL3 MUA data averaged across electrode penetrations. Mean normalized data for “shift 3rd,” “shift F0,” “shift 6th,” and “stretched” stimulus blocks are represented in A–D, respectively. Number of electrode penetrations contributing to the mean data for “shift 3rd,” “shift F0,” “shift 6th,” and “stretched” stimulus blocks is 46, 46, 22, and 22, respectively. Data for the three response time windows analyzed are represented in separate columns, as indicated. The red horizontal dashed line superimposed on the graphs indicates the mean normalized response amplitude under the harmonic condition. Error bars represent SEM. Statistically significant (p < 0.05) increases and decreases in mean normalized MUA amplitude under mistuned conditions relative to the harmonic condition are indicated by red and blue asterisks, respectively, placed above the bars. The p value associated with each of the planned one-tailed t tests comparing normalized MUA amplitude under mistuned and harmonic conditions is represented by the number of asterisks, as identified in the legend at the bottom of the figure. Additional planned t tests include comparisons (represented by the double arrows) between mean normalized responses under the 8% and 16% mistuning conditions of the “shift F0” stimulus block. For all comparisons, mean normalized responses to 16% mistuned stimuli are significantly larger than those to 8% mistuned stimuli (p < 0.05). Red numbers superimposed on the black bars in B and C indicate the difference in percentage points between mean normalized response amplitudes under mistuned and harmonic conditions.
Figure 7.
Figure 7.
Comparison between effect sizes (as quantified by Cohen's d) under “shift F0” (white bars) and “shift 6th” (black bars) conditions for LL3 MUA integrated within the three response windows analyzed, as indicated. See Materials and Methods for details.
Figure 8.
Figure 8.
Mistuning-related response enhancements are maximal when the frequency of the mistuned component is equal to the BF. Mean differences between amplitudes of LL3 MUA (averaged within the “total” response window) evoked by mistuned and harmonic stimuli are significantly diminished when the frequency of the mistuned third harmonic is >0.5 octave above or below the BF (asterisks) compared to when the frequency of the mistuned component is equal to the BF (i.e., under the “shift F0” condition; bars in center of the figure above zero amplitude). Bars in center of the figure below zero amplitude represent mean data under the “shift 3rd” condition. Data for upward and downward shifts of stimulus components are represented by black and white bars, respectively. Error bars represent SEM. See Results for details.
Figure 9.
Figure 9.
Examples of temporally modulated responses evoked by harmonic and mistuned stimuli. LL3 MUA recorded at two A1 sites (A, B) displays temporal patterns that are phase locked to the F0 and predicted “beat” frequencies of the stimuli (harmonic, “shift F0” 16% up, and “shift F0” 16% down, as indicated). Plots on the top row (black) and bottom row (blue) of A and B represent MUA waveforms and corresponding spectra (discrete Fourier transform of MUA waveform from 10 to 250 ms after stimulus onset), respectively. BFs of sites represented in A and B are 350 Hz and 250 Hz, respectively. Stimulus duration is represented by the black horizontal bar above the waveforms. Green and red numbers in the response spectra indicate the frequency of spectral peaks corresponding to the F0 and “beat” frequencies of the stimuli, respectively. The value of the mean MUA computed over the “total” response window is indicated above the MUA waveforms.
Figure 10.
Figure 10.
Mean Pearson correlation coefficients (transformed to Fisher's Zr) quantifying the degree of similarity between temporal response patterns evoked by mistuned and harmonic stimuli. Mean Z-transformed correlation coefficients for responses to stimuli comprising the “shift 3rd,” “shift F0,” “shift 6th,” and “stretched” stimulus blocks are represented in A–D, respectively. Data for the three response time windows analyzed are represented in separate columns, as indicated. Error bars indicate SEM. Note the different ordinate range of the plots for the different response time windows. Except where indicated by “ns,” all differences between mean correlations obtained under mistuned and harmonic conditions are statistically significant (planned one-tailed paired t test), with p values ranging from <10−2 to <10−12. Sample sizes for each stimulus condition are the same as those in Figure 6. See Results for details.
Figure 11.
Figure 11.
Relationship between BF (third harmonic frequency) and the Pearson correlation coefficient (r) quantifying the similarity between waveforms of “sustained” LL3 MUA evoked by mistuned and harmonic stimuli under the “shift F0” condition. Correlation coefficients for upward and downward directions of mistuning and for degrees of mistuning of 8 and 16% are plotted in different colors, as indicated in the legend. Correlation coefficients tend to be lower for responses evoked by stimuli with lower third harmonic frequencies, indicating greater dissimilarity between responses evoked by mistuned and harmonic stimuli. This trend is quantified by Pearson correlation coefficients included in the legend (computed as r vs log BF) and emphasized by the superimposed color-coded linear regression lines. All four correlations are statistically significant (n = 46; p < 0.0005).
Figure 12.
Figure 12.
Mean Pearson correlation coefficients (transformed to Fisher's Zr) quantifying the degree of similarity between waveforms of LL3 MUA evoked by mistuned and harmonic stimuli when the frequency of the mistuned third harmonic, before mistuning, is equal to the BF (under the “shift 3rd” condition; n = 16), near the BF (between 0.25 and 0.5 octave away; n = 14), and far from the BF (between 0.5 and 1 octave away; n = 16). Error bars represent SEM. Correlation coefficients are collapsed across direction of mistuning and across position of the third harmonic above and below the BF. Mean (Z-transformed) correlation coefficients for the three response windows analyzed are represented in separate plots, as indicated. Correlation coefficients are significantly larger (indicating greater similarity between responses) when the frequency of the mistuned component is far from the BF than when it is equal to the BF (planned one-tailed unpaired t test; p values are represented by the number of asterisks, as indicated at the bottom of the figure). Note the different ordinate range of the plot for “sustained” responses. All data are derived from the same 16 electrode penetrations at which “fixed F0” stimuli were presented.
Figure 13.
Figure 13.
Potential intracortical monkey homologs of the human ORN and P230 difference-waveform components. Mean difference waveforms are obtained by subtracting AEPs evoked by harmonic stimuli from AEPs evoked by mistuned stimuli presented in the “shift 3rd” (A) and “shift F0” (B) stimulus blocks and averaging across electrode penetrations. The ordinate represents the t score obtained for each time-point comparison; the green dashed lines denote t scores corresponding to a p value of 0.05. Mean difference waveforms under 8% and 16% mistuning conditions are plotted separately, as indicated. Mean difference waveforms for AEPs evoked by stimuli with upward and downward mistunings are plotted in blue and red, respectively. N refers to the number of sites contributing to mean difference waveforms. Mean difference waveforms for AEPs recorded at cortical depths corresponding to the location of the LL3 sink, the SG sink, and the SG source are plotted in separate rows, as indicated. Stimulus duration is represented by the horizontal black bar above the time axes. Two prominent difference-waveform components proposed to represent monkey homologs of the human ORN and P230 components are labeled ORNm and ORPm, respectively, in the plots of SG source data in A and B. Peak latencies of the two components are ∼150 and 230 ms, respectively.

References

    1. Alain C, McDonald KL. Age-related differences in neuromagnetic brain activity underlying concurrent sound perception. J Neurosci. 2007;27:1308–1314. - PMC - PubMed
    1. Alain C, Arnott SR, Picton TW. Bottom-up and top-down influences on auditory scene analysis: evidence from event-related brain potentials. J Exp Psychol Hum Percept Perform. 2001;27:1072–1089. - PubMed
    1. Alain C, Schuler BM, McDonald KL. Neural activity associated with distinguishing concurrent auditory objects. J Acoust Soc Am. 2002;111:990–995. - PubMed
    1. Arezzo JC, Vaughan HG, Jr, Kraut MA, Steinschneider M, Legatt AD. Intracranial generators of event-related potentials in the monkey. In: Cracco RQ, Bodis-Wollner I, editors. Frontiers of clinical neuroscience: evoked potentials. Vol 3. New York: Liss; 1986. pp. 174–189.
    1. Bieser A, Müller-Preuss P. Auditory responsive cortex in the squirrel monkey: neural responses to amplitude-modulated sounds. Exp Brain Res. 1996;108:273–284. - PubMed

Publication types