. 2010 Sep 15;30(37):12535-44.
doi: 10.1523/JNEUROSCI.1920-10.2010.

Pathogenic lysosomal depletion in Parkinson's disease

Affiliations

Pathogenic lysosomal depletion in Parkinson's disease

Benjamin Dehay et al. J Neurosci. .

Abstract

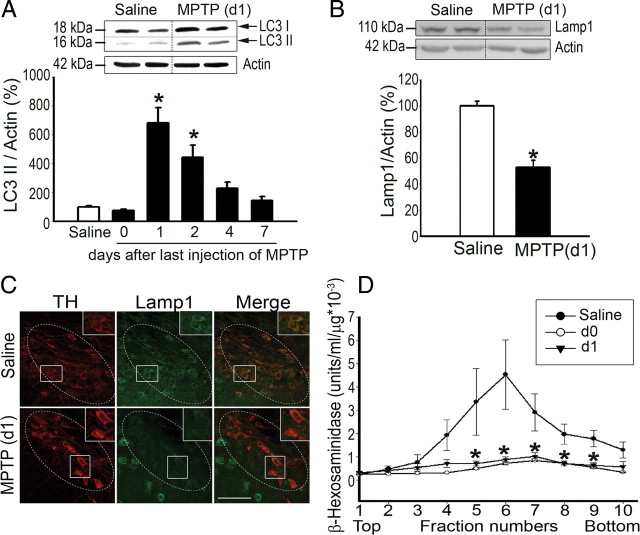
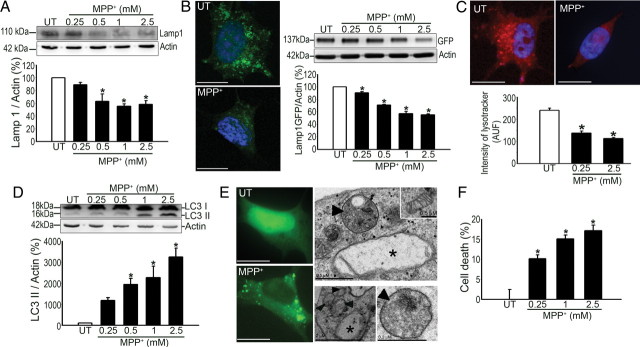
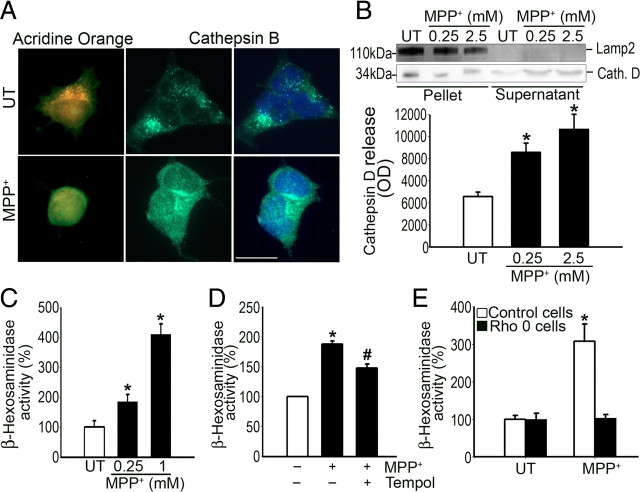
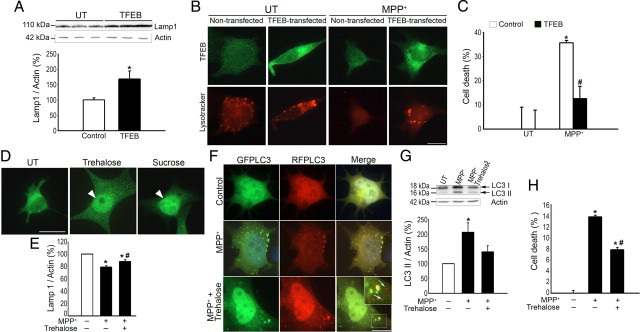
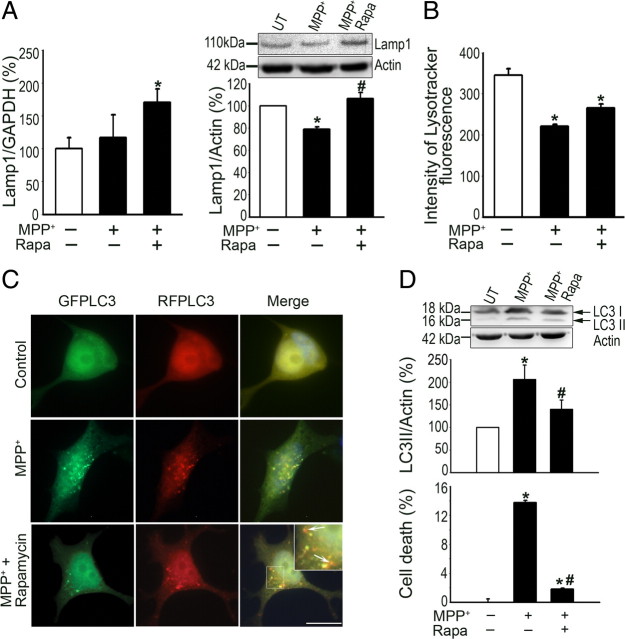
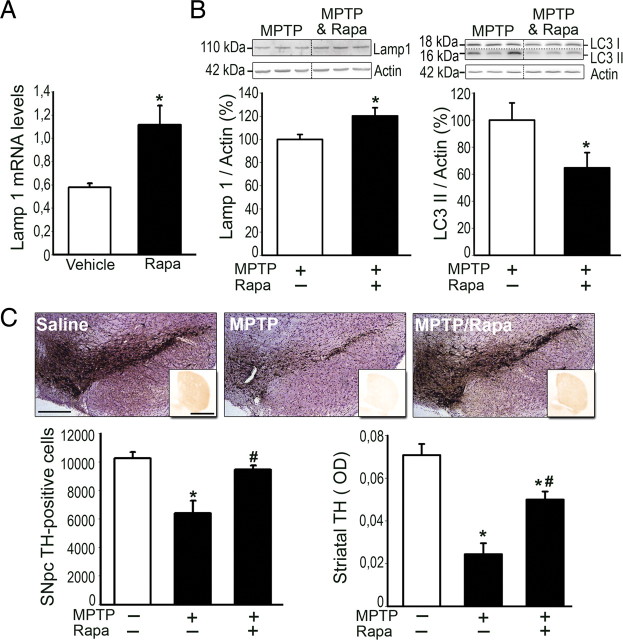
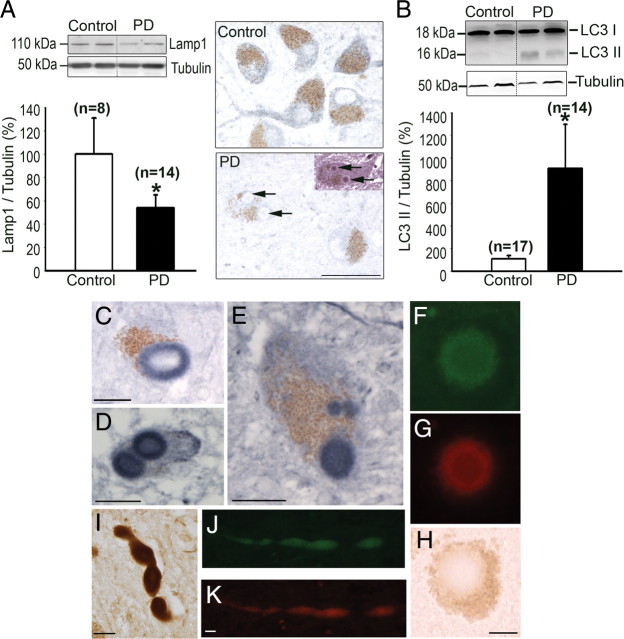
Mounting evidence suggests a role for autophagy dysregulation in Parkinson's disease (PD). The bulk degradation of cytoplasmic proteins (including α-synuclein) and organelles (such as mitochondria) is mediated by macroautophagy, which involves the sequestration of cytosolic components into autophagosomes (AP) and its delivery to lysosomes. Accumulation of AP occurs in postmortem brain samples from PD patients, which has been widely attributed to an induction of autophagy. However, the cause and pathogenic significance of these changes remain unknown. Here we found in the 1-methyl-4-phenyl-1,2,3,6-tetrahydropyridine mouse model of PD that AP accumulation and dopaminergic cell death are preceded by a marked decrease in the amount of lysosomes within dopaminergic neurons. Lysosomal depletion was secondary to the abnormal permeabilization of lysosomal membranes induced by increased mitochondrial-derived reactive oxygen species. Lysosomal permeabilization resulted in a defective clearance and subsequent accumulation of undegraded AP and contributed directly to neurodegeneration by the ectopic release of lysosomal proteases into the cytosol. Lysosomal breakdown and AP accumulation also occurred in PD brain samples, where Lewy bodies were strongly immunoreactive for AP markers. Induction of lysosomal biogenesis by genetic or pharmacological activation of lysosomal transcription factor EB restored lysosomal levels, increased AP clearance and attenuated 1-methyl-4-phenylpyridinium-induced cell death. Similarly, the autophagy-enhancer compound rapamycin attenuated PD-related dopaminergic neurodegeneration, both in vitro and in vivo, by restoring lysosomal levels. Our results indicate that AP accumulation in PD results from defective lysosomal-mediated AP clearance secondary to lysosomal depletion. Restoration of lysosomal levels and function may thus represent a novel neuroprotective strategy in PD.


Figures

Figure 1.
Figure 1.
Lysosomal depletion and AP accumulation in MPTP-intoxicated mice. A, LC3II immunoblot levels in ventral midbrain protein homogenates from saline- and MPTP-injected mice. B, Immunoblot Lamp1 levels in ventral midbrain protein homogenates from saline- and MPTP-injected mice at day 1 post-MPTP. C, Double immunofluorescence with Lamp1 (green) and TH (red) in ventral midbrain sections of saline- and MPTP-injected mice at day 1 post-MPTP. D, β-Hexoaminidase enzymatic activity in ventral midbrain lysosomal-enriched fractions (fractions 5, 6, and 7) from saline- and MPTP-injected mice at day 0 and day 1 post-MPTP. In all experiments, n = 5–7 animals per experimental group. *p < 0.05 compared with saline-injected mice. In C, white dotted line delimits SNpc. Scale bar, 10 μm.
Figure 2.
Figure 2.
Lysosomal depletion and AP accumulation in MPP+-treated cells. A, Lamp1 immunoblot levels in human dopaminergic BE-M17 neuroblastoma cells intoxicated with different doses of MPP+ for 24 h. B, Left, Lamp1-GFP fluorescent signal (green; nucleus in blue) in untreated (UT) and MPP+-intoxicated transfected cells. B, Right, GFP immunoblot levels in UT and MPP+-intoxicated Lamp1-GFP-transfected cells. C, Top, LysoTracker fluorescent pattern (red; nucleus in blue) in UT and MPP+-intoxicated cells. C, Bottom, Intensity of LysoTracker fluorescent signal in UT and MPP+-intoxicated cells, quantified by flow cytometry. D, LC3II immunoblot levels in UT and MPP+-intoxicated cells. E, Left, GFP-LC3 fluorescent signal (green) in UT and MPP+-intoxicated transfected cells. E, Right, Electron microscopy images from MPP+-intoxicated cells (arrowheads, AP; asterisks, abnormal mitochondria; inset, normal mitochondria). F, Cell death in UT and MPP+-intoxicated cells, as assessed by MTT assay. In all panels, n = 3–5 per experimental group. MPP+, 0.25 mm (unless otherwise indicated). *p < 0.05 compared with UT cells. Scale bars, 10 μm (unless otherwise indicated).
Figure 3.
Figure 3.
Lysosomal membrane permeabilization in MPP+-treated cells. A, Left, Acridine orange fluorescent signal in UT and MPP+-intoxicated cells. A, Right, Cathepsin B immunofluorescent signal (green; nuclei in blue) in UT and MPP+-intoxicated cells. B, Cathepsin D immunoblot levels in pellet and supernatant lysosomal fractions from UT and MPP+-intoxicated cells. Lamp2 was used as a lysosomal marker. C, β-Hexosaminidase enzymatic activity in lysosomal-free cytosolic fractions from UT and MPP+-intoxicated cells. D, β-Hexosaminidase enzymatic activity in lysosomal-free cytosolic fractions from UT and MPP+-intoxicated cells, treated or not with tempol (500 μm for 24 h). E, β-Hexosaminidase enzymatic activity in lysosomal-free cytosolic fractions from UT and MPP+-intoxicated Rho0 and control cells. In all panels, n = 3–5 per experimental group. MPP+, 0.25 mm (unless otherwise indicated). *p < 0.05 compared with UT cells. # p < 0.05 compared with MPP+-treated cells. Scale bar, 10 μm.
Figure 4.
Figure 4.
Enhancement of lysosomal biogenesis by TFEB attenuates MPP+-induced cell death. A, Lamp1 immunoblot levels in control or TFEB-transfected cells. B, LysoTracker fluorescent signal (red) in control or TFEB-transfected cells, UT or intoxicated with MPP+. In transfected cells, TFEB is detected by immunofluorescence (green). C, Cell death in control or TFEB-transfected cells, UT or intoxicated with MPP+, as assessed by MTT assay. D, TFEB immunofluorescence (green) in nontransfected cells, UT or treated with trehalose (1 mm) or sucrose (100 mm) for 24 h. E, Lamp1 immunoblot levels in UT and MPP+-intoxicated nontransfected cells, treated or not with trehalose. F, Fluorescent signal of GFP-LC3 (green) and RFP-LC3 (red) in UT and MPP+-intoxicated tfLC3-transfected cells, treated or not with trehalose (arrows indicate autophagolysosomes, visualized as red-only structures). G, LC3II immunoblot levels in UT and MPP+-intoxicated cells, treated or not with trehalose. H, Cell death in UT and MPP+-intoxicated cells, treated or not with trehalose, as assessed by MTT assay. In all panels, n = 3–5 per experimental group. MPP+, 0.25 mm, unless otherwise indicated. *p < 0.05 compared with UT cells. #p < 0.05 compared with MPP+-treated cells. Scale bar, 10 μm.
Figure 5.
Figure 5.
Rapamycin attenuates MPP+-induced cell death in vitro by enhancing lysosomal biogenesis and AP clearance. A, Lamp1 mRNA (left) and protein (right) levels, assessed by reverse transcriptase PCR and immunoblot, respectively, in UT and MPP+-intoxicated cells, treated or not with rapamycin (10 nm, for 24 h). B, Intensity of LysoTracker fluorescent signal, quantified by flow cytometry, in UT and MPP+-intoxicated cells, treated or not with rapamycin. C, Fluorescent signal of GFP-LC3 (green) and RFP-LC3 (red) in UT and MPP+-intoxicated tfLC3-transfected cells, treated or not with rapamycin (arrows indicate autophagolysosomes, visualized as red-only structures). D, Top, LC3II immunoblot levels in UT and MPP+-intoxicated cells, treated or not with rapamycin. D, Bottom, Cell death in UT and MPP+-intoxicated cells, treated or not with rapamycin, as assessed by MTT assay. In all experiments, rapamycin treatment was initiated 24 h after MPP+ intoxication and extended for an additional 24 h. In A–D, n = 3–5 per experimental group. MPP+, 0.25 mm. *p < 0.05 compared with UT cells. # p < 0.05 compared with MPP+-treated cells. Scale bar, 10 μm.
Figure 6.
Figure 6.
Rapamycin attenuates MPTP-induced dopaminergic neurodegeneration in vivo by enhancing lysosomal biogenesis and AP clearance. A, Lamp1 mRNA levels in ventral midbrain homogenates from vehicle- or rapamycin-injected mice (i.p., 7.5 mg/kg/d for seven consecutive days; n = 5 animals per group). *p < 0.05 compared with vehicle-injected mice. B, Lamp1 and LC3II immunoblot levels in MPTP-intoxicated mice, treated or not with Rapamycin, at day 1 post-MPTP (n = 9 for MPTP-intoxicated mice, n = 8 for MPTP + rapamycin-treated animals). *p ≤ 0.05 compared with MPTP-intoxicated mice. C, Stereological cell counts of SNpc TH-immunoreactive neurons (left panel) and optical densitometry of striatal TH immunoreactivity (right panel) from saline- or MPTP-intoxicated mice, treated or not with rapamycin, at day 21 post-MPTP (n = 9 for vehicle-injected animals, n = 10 for MPTP-treated mice, and n = 15 for MPTP + rapamycin-treated animals). Top panels display representative photomicrographs of TH-immunostained SNpc (brown; thionin in blue) and striatum (inset) in these animals. *p < 0.05 compared with vehicle-injected mice, # p < 0.05 compared with MPTP-intoxicated mice.
Figure 7.
Figure 7.
Lysosomal depletion and AP accumulation in postmortem PD samples. A, Left, Lamp1 immunoblot levels in postmortem substantia nigra protein homogenates from PD patients and age-matched control subjects. A, Right, Lamp1 immunostaining (blue; brown pigment corresponds to neuromelanin) in postmortem substantia nigra sections from PD patients and age-matched control subjects. Arrows indicate Lamp1-negative Lewy bodies, identified by hematoxylin and eosin staining (pink, inset). B, LC3II immunoblot levels in postmortem substantia nigra protein homogenates from PD patients and age-matched control subjects. C–E, LC3-immunoreactive Lewy bodies (blue; brown pigment correspond to neuromelanin) in postmortem substantia nigra sections from PD patients. F–H, Lewy bodies were immunolabeled with both α-synuclein (green, F) and LC3 (red, G). In H, brown pigment corresponds to neuromelanin in transmitted light. I–K, LC3 immunoreactivity was also detected in Lewy neurites in postmortem substantia nigra sections from PD patients (I, LC3 in brown; J, K, LC3 in green, α-synuclein in red). In all panels, *p < 0.05 compared with age-matched control subjects. Scale bars, 10 μm.

References

    1. Aharon-Peretz J, Rosenbaum H, Gershoni-Baruch R. Mutations in the glucocerebrosidase gene and Parkinson's disease in Ashkenazi Jews. N Engl J Med. 2004;351:1972–1977. - PubMed
    1. Anglade P, Vyas S, Javoy-Agid F, Herrero MT, Michel PP, Marquez J, Mouatt-Prigent A, Ruberg M, Hirsch EC, Agid Y. Apoptosis and autophagy in nigral neurons of patients with Parkinson's disease. Histol Histopathol. 1997;12:25–31. - PubMed
    1. Barrachina M, Maes T, Buesa C, Ferrer I. Lysosome-associated membrane protein 1 (LAMP-1) in Alzheimer's disease. Neuropathol Appl Neurobiol. 2006;32:505–516. - PubMed
    1. Boya P, Kroemer G. Lysosomal membrane permeabilization in cell death. Oncogene. 2008;27:6434–6451. - PubMed
    1. Boya P, Andreau K, Poncet D, Zamzami N, Perfettini JL, Metivier D, Ojcius DM, Jäättelä M, Kroemer G. Lysosomal membrane permeabilization induces cell death in a mitochondrion-dependent fashion. J Exp Med. 2003;197:1323–1334. - PMC - PubMed

Publication types

MeSH terms

LinkOut - more resources