. 2010 Dec;299(6):R1478-88.
doi: 10.1152/ajpregu.00273.2010. Epub 2010 Sep 15.

Circulation and metabolic rates in a natural hibernator: an integrative physiological model

Affiliations

Circulation and metabolic rates in a natural hibernator: an integrative physiological model

Marshall Hampton et al. Am J Physiol Regul Integr Comp Physiol. 2010 Dec.

Abstract

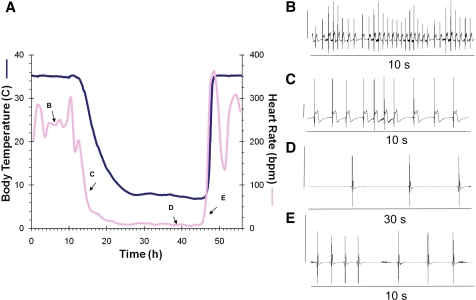
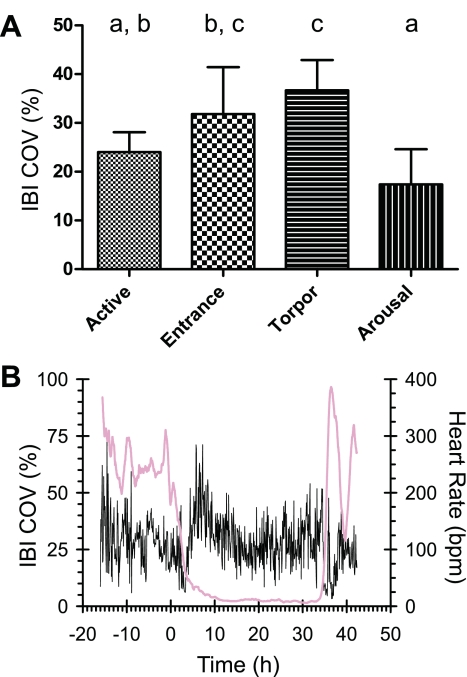
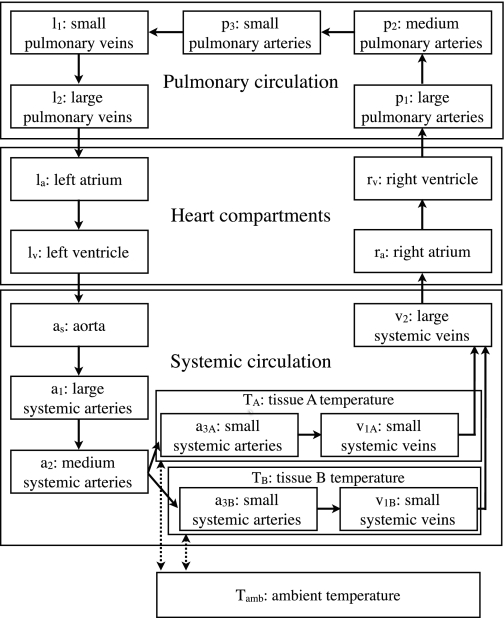
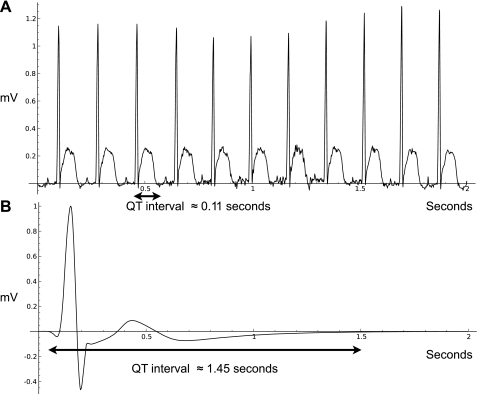
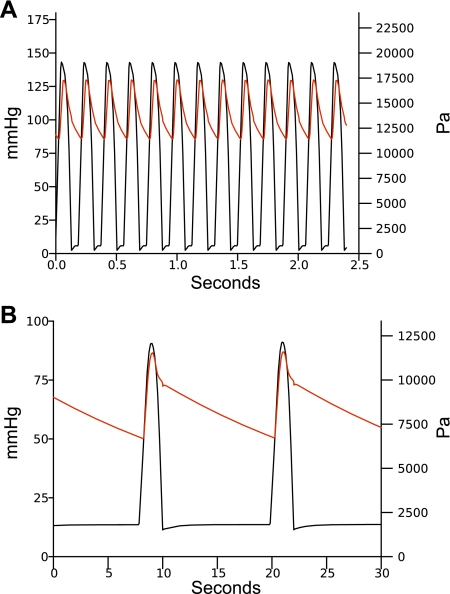
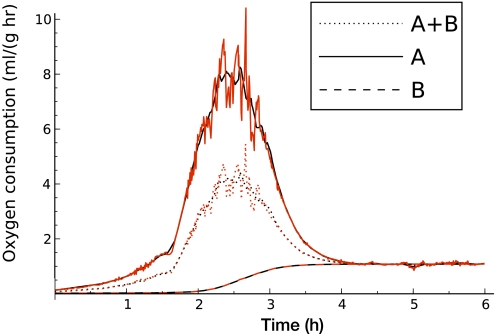
Small hibernating mammals show regular oscillations in their heart rate and body temperature throughout the winter. Long periods of torpor are abruptly interrupted by arousals with heart rates that rapidly increase from 5 beats/min to over 400 beats/min and body temperatures that increase by ∼30°C only to drop back into the hypothermic torpid state within hours. Surgically implanted transmitters were used to obtain high-resolution electrocardiogram and body temperature data from hibernating thirteen-lined ground squirrels (Spermophilus tridecemlineatus). These data were used to construct a model of the circulatory system to gain greater understanding of these rapid and extreme changes in physiology. Our model provides estimates of metabolic rates during the torpor-arousal cycles in different model compartments that would be difficult to measure directly. In the compartment that models the more metabolically active tissues and organs (heart, brain, liver, and brown adipose tissue) the peak metabolic rate occurs at a core body temperature of 19°C approximately midway through an arousal. The peak metabolic rate of the active tissues is nine times the normothermic rate after the arousal is complete. For the overall metabolic rate in all tissues, the peak-to-resting ratio is five. This value is high for a rodent, which provides evidence for the hypothesis that the arousal from torpor is limited by the capabilities of the cardiovascular system.


Figures

Fig. 1.
Fig. 1.
A: simultaneous tracing of heart rate (pink line; 1-h moving average) and core body temperature (blue line) collected with an implanted transmitter in a thirteen-lined ground squirrel during the initial seasonal torpor bout (November) at an ambient temperature of 5°C. ECG readings from the indicated points on the heart rate tracing show 10-s interval where the heart rate was ∼240 beats/min (inset B); entry into torpor over 10 s at a heart rate of ∼80 beats/min (inset C); 30 s during torpor to show multiple beats at a heart rate of 8 beats/min (inset D); arousal ECG where the heart rate is 15 beats/min (inset E). In B–E the vertical line on the left side of the ECG equals 1 mV to indicate the changes in height of the R peak.
Fig. 2.
Fig. 2.
Occurrence of arrhythmias during a torpor bout in thirteen-lined ground squirrels. The level of arrhythmias was measured by calculating the interbeat interval (IBI) coefficient of variation (COV) for 8 squirrels during the first seasonal torpor bout at 5°C (A). Arrhythmic patterns occurred more frequently as squirrels entered and maintained a torpor bout and less frequently during the arousal phase. Groups shown to be statistically different by an ANOVA followed by a Tukey's test do not share the same letter above the bar. B: example of the changes in IBI COV (black) relative to the changes in heart rate (pink). For comparison, the same animal is used as an example as in Fig. 1.
Fig. 3.
Fig. 3.
Circulation compartments of the hibernator model.
Fig. 4.
Fig. 4.
ECGs from 2 squirrels over a time period of 2 s. A: data are from a squirrel at 35.1°C and a heart rate of 333 beats/min, during the middle of an IBA. B: data are from a squirrel in torpor with a temperature of 5.2°C and a heart rate of 5 beats/min.
Fig. 5.
Fig. 5.
Model blood pressures. In both plots, the black line is the left ventricular pressure and the red line is the pressure in the large systemic arteries compartment (a1). A: pressures for a heart rate of 320 beats/min with a fixed blood temperature of 35.0°C. B: pressures for a heart rate of 5 beats/min with a fixed blood temperature of 7.7°C.
Fig. 6.
Fig. 6.
Oxygen consumption during arousal from torpor (model output) driven by averaged (black) and raw data (red) from a single animal. Solid lines are from compartment A, dashed lines are from compartment B, and dotted lines are A+B. Plot begins at the start of an arousal.

References

    1. Andrews MT. Advances in molecular biology of hibernation in mammals. Bioessays 29: 431–607 440, 2007 - PubMed
    1. Barnes BM. Freeze avoidance in a mammal: body temperatures below 0 degree C in an arctic hibernator. Science 244: 1593–1595, 1989 - PubMed
    1. Bassett DJ, Howley E. Limiting factors for maximum oxygen uptake and determinants of endurance performance. Med Sci Sports Exerc 32: 70–84, 2000 - PubMed
    1. Bigelow WG, Lindsay WK, Greenwood WF. Hypothermia: its possible role in cardiac surgery. Ann Surg 132: 849–866, 1950 - PMC - PubMed
    1. Blake AS, Petley GW, Deakin CD. Effects of changes in packed cell volume on the specific heat capacity of blood: implications for studies measuring heat exchange in extracorporeal circuits. Br J Anaesth 84: 28–32, 2000 - PubMed

Publication types

LinkOut - more resources