. 2011 Mar;5(3):461-72.
doi: 10.1038/ismej.2010.141. Epub 2010 Sep 16.

Quantitative analysis of a deeply sequenced marine microbial metatranscriptome

Affiliations

Quantitative analysis of a deeply sequenced marine microbial metatranscriptome

Scott M Gifford et al. ISME J. 2011 Mar.

Abstract

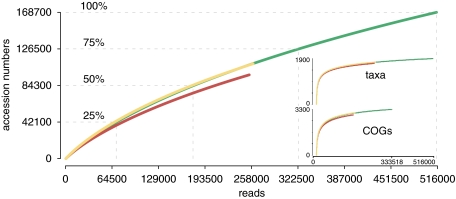
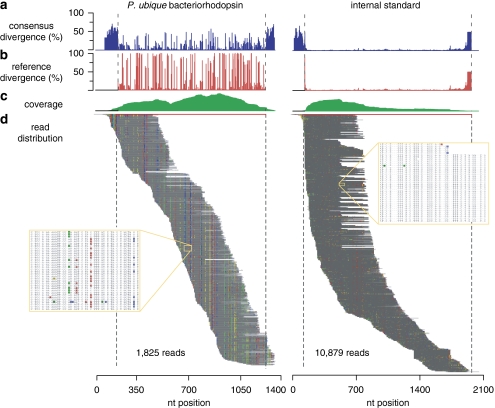
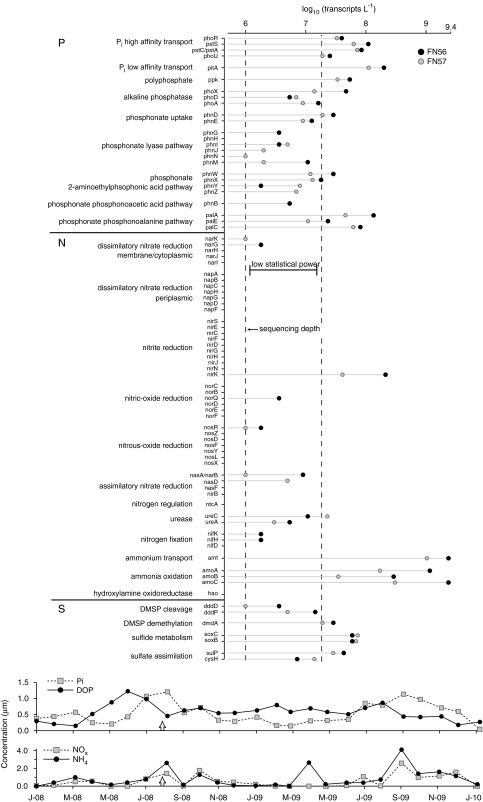
The potential of metatranscriptomic sequencing to provide insights into the environmental factors that regulate microbial activities depends on how fully the sequence libraries capture community expression (that is, sample-sequencing depth and coverage depth), and the sensitivity with which expression differences between communities can be detected (that is, statistical power for hypothesis testing). In this study, we use an internal standard approach to make absolute (per liter) estimates of transcript numbers, a significant advantage over proportional estimates that can be biased by expression changes in unrelated genes. Coastal waters of the southeastern United States contain 1 × 10(12) bacterioplankton mRNA molecules per liter of seawater (~200 mRNA molecules per bacterial cell). Even for the large bacterioplankton libraries obtained in this study (~500,000 possible protein-encoding sequences in each of two libraries after discarding rRNAs and small RNAs from >1 million 454 FLX pyrosequencing reads), sample-sequencing depth was only 0.00001%. Expression levels of 82 genes diagnostic for transformations in the marine nitrogen, phosphorus and sulfur cycles ranged from below detection (<1 × 10(6) transcripts per liter) for 36 genes (for example, phosphonate metabolism gene phnH, dissimilatory nitrate reductase subunit napA) to >2.7 × 10(9) transcripts per liter (ammonia transporter amt and ammonia monooxygenase subunit amoC). Half of the categories for which expression was detected, however, had too few copy numbers for robust statistical resolution, as would be required for comparative (experimental or time-series) expression studies. By representing whole community gene abundance and expression in absolute units (per volume or mass of environment), 'omics' data can be better leveraged to improve understanding of microbially mediated processes in the ocean.


Figures

Figure 1
Figure 1
Effect of sample-sequencing depth on quantification of transcripts (or genes) in environmental samples. ‘Equal-effort' sequences the same number of reads per sample volume, regardless of the size of the mRNA pool, and therefore conveys only relative abundance. ‘Known-depth' sequences a known proportion of the transcript pool (50% for both, in this example), and therefore also conveys absolute copy numbers per sample volume. The latter is more relevant to biogeochemical rate measurements, as mRNAs of biogeochemical interest (gray dots) can make up different proportions in community transcriptomes yet have identical numbers in the environment.
Figure 2
Figure 2
Collector's curve of gene richness as a function of reads analyzed. Light gray: FN56; dark gray: FN57; medium gray: combined libraries. Dashed lines indicate the number of reads needed to reach quarter percentiles of the total richness of the combined library. Inset: collector's curves for taxonomic and functional gene category (COG) richness, with the y axis corresponding to the number of unique reference organisms or COG numbers.
Figure 3
Figure 3
Assembly of 1825 reads (out of 2259 total) binning to the P. ubique HTCC1002 proteorhodopsin gene PU1002_03206 (left), and of 10 879 reads (out of 10 879 total) binning to the internal transcript standard (right). (a) Percent nucleotide divergence from the consensus sequence. (b) Percent nucleotide divergence from the reference sequence. (c) Coverage by nucleotide position. (d) Read assembly to the reference gene (shown in red), with dashed lines indicating start and end positions of the reference. Note that the reference gene lengths are extended by assembly gaps. Divergence from the consensus sequence (that is, the majority nucleotide at a given position) is indicated as follows: A= red, T= green, C= blue and G= yellow. Insets show close-up regions of assemblies.
Figure 4
Figure 4
Copy numbers of phosphorus, nitrogen and sulfur cycle transcripts in a coastal ocean microbial community. The left line represents the limit of detection for this study, and together with the right line defines the region where copy numbers are too low for robust statistical analysis (that is, where the fold-difference requirement is >2). Symbols indicate copy numbers in biological duplicates. Bottom graphs show monthly nutrient concentrations for GCE-LTER station six. The arrows mark the date of sample collection.
Figure 5
Figure 5
Minimum fold difference required for statistical significance (Xipe, P<0.05) as a function of both the count in the lower abundance sample and the library size. Samples and subsamples were from the combined libraries (FN56 and FN57). Marker color is based on the statistical outcome (significant or nonsignificant) and library size (percent of full library). (a) Zoom of region in the main figure. Note that the minimum fold-difference for significance is independent of the three library sizes analyzed. (b) An alternative analysis of the significance threshold using contingency tables and Fisher's exact test. The minimum fold-difference threshold at which a low abundance count is significant by the Fisher's exact test is plotted as a dotted black line. The results from the Xipe analysis (main figure) at the 100% library size are also shown in inset B for direct comparison with the Fisher's exact test.
Figure 6
Figure 6
Rank-order abundance of taxonomic bins (species or strain level). Main figure: top 50 taxonomic annotation bins; inset: all 1909 taxonomic annotation bins.

References

    1. Azam F, Hodson RE. Size distribution and activity of marine microheterotrophs. Limnol Oceanogr. 1977;22:492–501.
    1. Bürgmann H, Howard EC, Ye WY, Sun F, Sun SL, Napierala S, et al. Transcriptional response of Silicibacter pomeroyi DSS-3 to dimethylsulfoniopropionate (DMSP) Environ Microbiol. 2007;9:2742–2755. - PubMed
    1. Campbell BJ, Waidner LA, Cottrell MT, Kirchman DL. Abundant proteorhodopsin genes in the North Atlantic Ocean. Environ Microbiol. 2008;10:99–109. - PubMed
    1. Cho J-C, Giovannoni SJ. Cultivation and growth characteristics of a diverse group of oligotrophic marine gammaproteobacteria. Appl Environ Microbiol. 2004;70:432–440. - PMC - PubMed
    1. Church MJ, Wai B, Karl DM, DeLong EF. Abundances of crenarchaeal amoA genes and transcripts in the Pacific Ocean. Environ Microbiol. 2010;12:679–688. - PMC - PubMed

Publication types