. 2010 Sep 9;6(9):e1001099.
doi: 10.1371/journal.ppat.1001099.

The epidermal growth factor receptor (EGFR) promotes uptake of influenza A viruses (IAV) into host cells

Affiliations

The epidermal growth factor receptor (EGFR) promotes uptake of influenza A viruses (IAV) into host cells

Thorsten Eierhoff et al. PLoS Pathog. .

Abstract

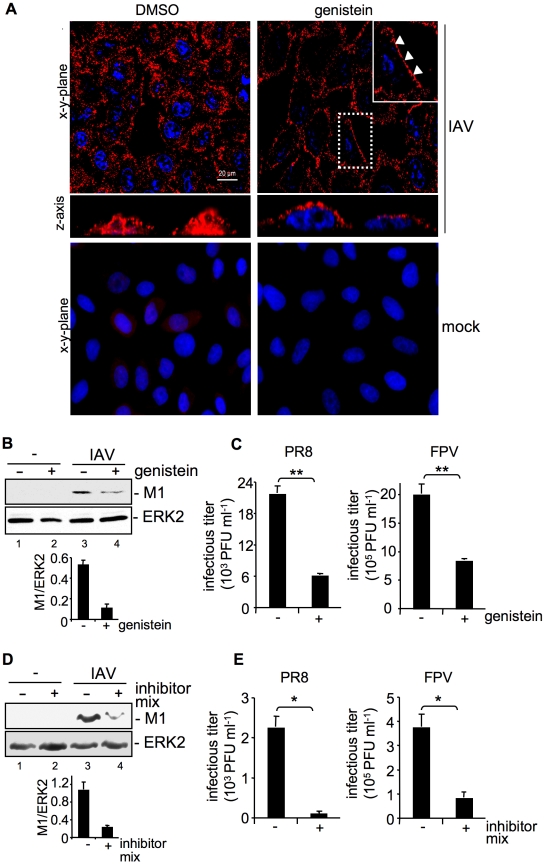
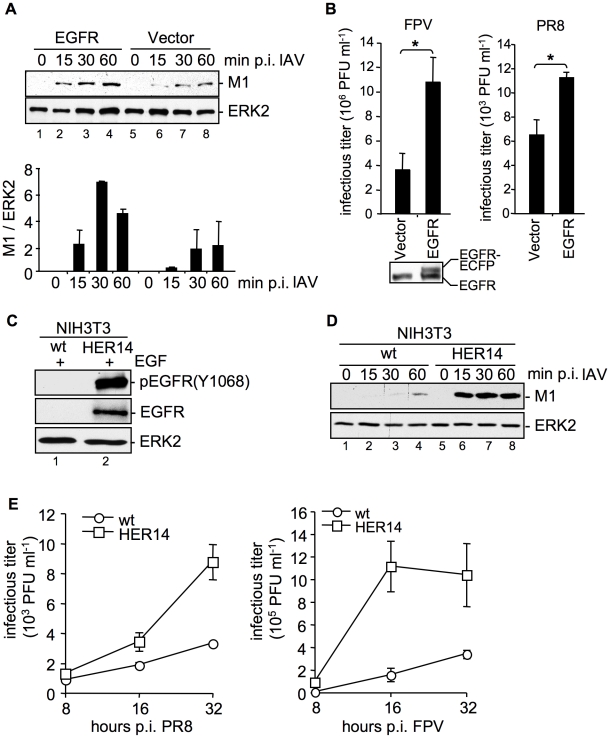
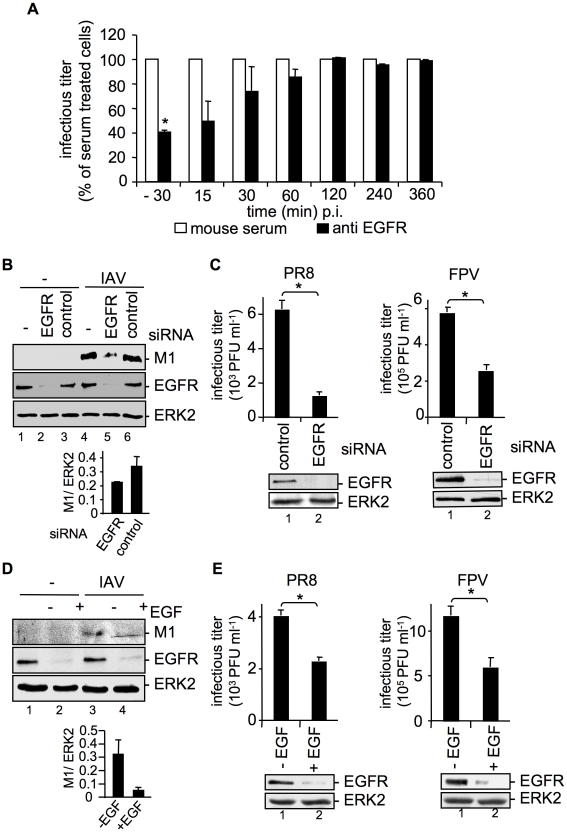
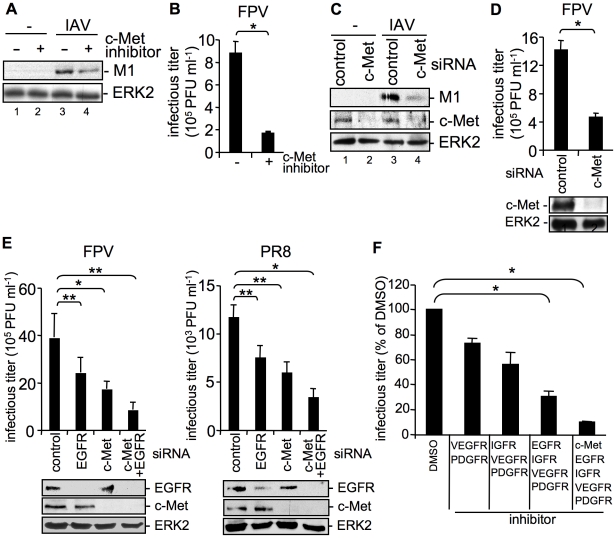
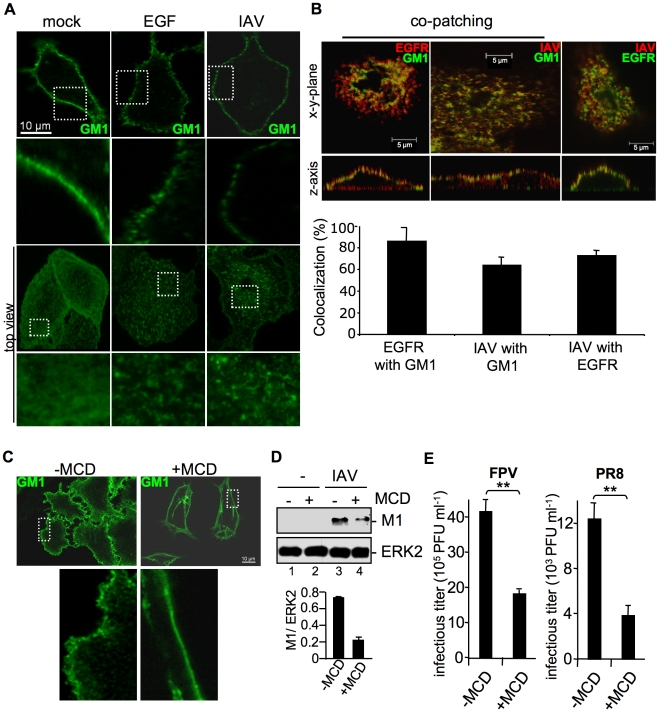
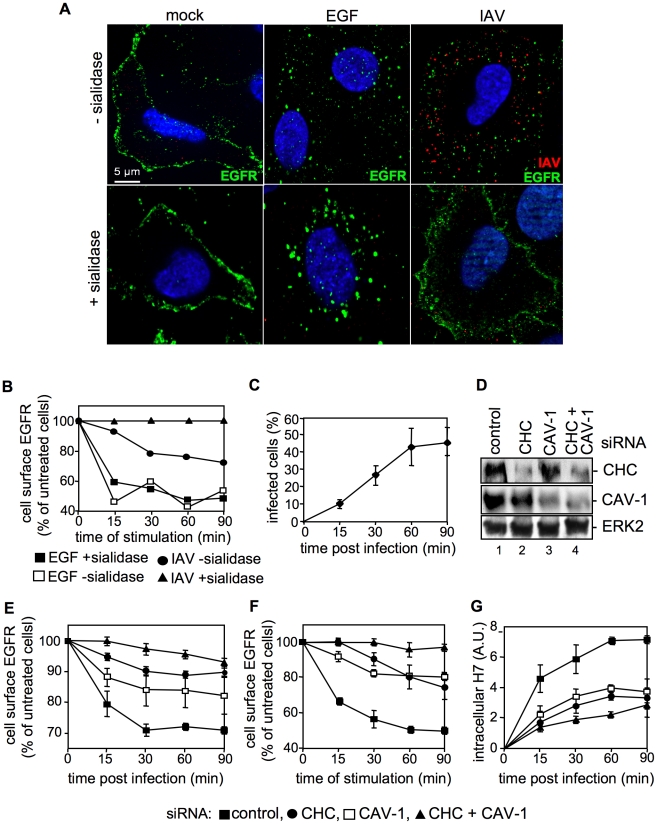
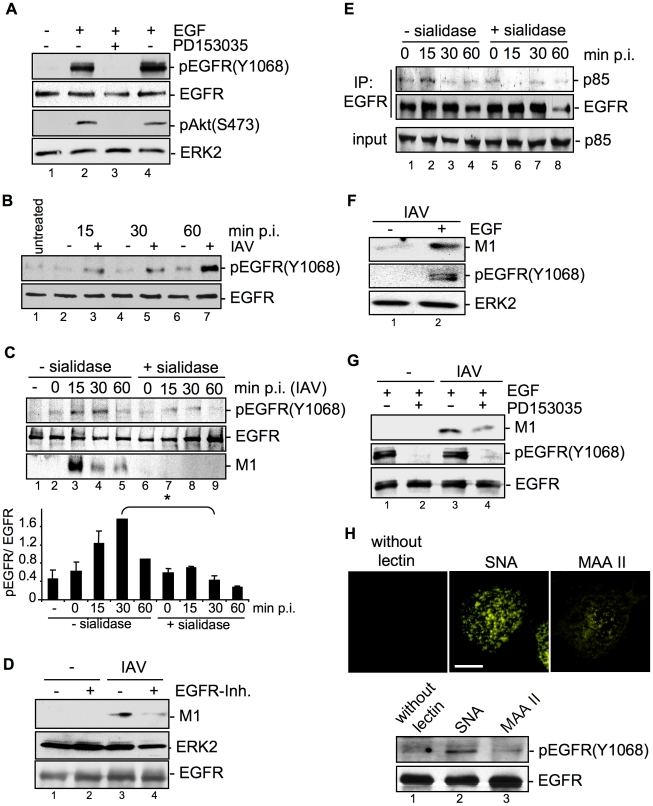
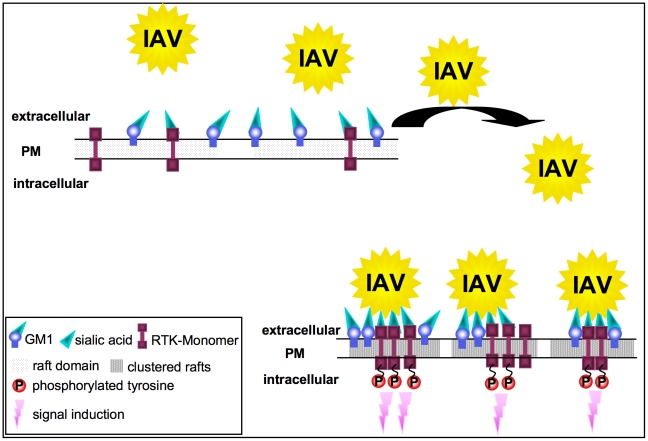
Influenza A viruses (IAV) bind to sialic-acids at cellular surfaces and enter cells by using endocytotic routes. There is evidence that this process does not occur constitutively but requires induction of specific cellular signals, including activation of PI3K that promotes virus internalization. This implies engagement of cellular signaling receptors during viral entry. Here, we present first indications for an interplay of IAV with receptor tyrosine kinases (RTKs). As representative RTK family-members the epidermal growth factor receptor (EGFR) and the c-Met receptor were studied. Modulation of expression or activity of both RTKs resulted in altered uptake of IAV, showing that these receptors transmit entry relevant signals upon virus binding. More detailed studies on EGFR function revealed that virus binding lead to clustering of lipid-rafts, suggesting that multivalent binding of IAV to cells induces a signaling platform leading to activation of EGFR and other RTKs that in turn facilitates IAV uptake.


Conflict of interest statement

The authors have declared that no competing interests exist.

Figures

Figure 1
Figure 1. Tyrosine kinase activity is required for efficient uptake of IAV.
(A, B, C) A549 cells were treated with genistein (50 µM, [+]) or (D, E) a mixture of several RTK inhibitors (each 10 µM, [+] see experimental procedures) or the solvent control (DMSO,[−]) respectively for 60 min at 37°C or over night prior to infection. (A) Upon genistein treatment, cells were either mock infected or infected with influenza virus A/FPV/Bratislava/79 (H7N7) (FPV; MOI = 100) for further 30 min. Virus particles were visualized in immunofluorescence (IF) microscopy, via a hemagglutinin (HA)-specific rabbit antiserum and an Alexa 594-conjugated chicken anti-rabbit IgG. The nuclei were stained with DAPI. The white arrowheads point to virus particles lining at the cell border. (B, D) After infection with influenza virus A/Puerto-Rico/8/34 (H1N1) PR8 (MOI = 8) for further 30 min, an acidic wash (PBS, pH 1.3, 4°C) was performed before cell-lysis. Internalized virus particles were visualized with a M1 monoclonal antibody in Western-blot (WB) analysis. Equal protein load was verified by ERK2 detection. The relative amount of M1 was quantified (B and D lower panels). Relative M1 densities are expressed as mean ±SD of three independent experiments. (C, E) Cells were infected with FPV or PR8 (MOI = 4) for 8 h; upon the virus-attachment period an acidic wash (PBS-HCl, pH 5.5) was included. Progeny virus titers were determined by standard plaque assays. Data represent mean values of at least three independent experiments ±SD. Statistical significance was assessed by student's t-test (*) p<0.05, (**) p<0.005. See also Figure S1.
Figure 2
Figure 2. EGFR is involved in IAV uptake.
(A, B) An EGFR expressing construct was transfected into A549 cells. (A) After 24 h cells were infected with PR8 (MOI = 4) for the indicated time points. An acidic wash (PBS, pH 1.3, 4°C) was performed before cell-lysis to remove not internalized virus particles. In WB analysis M1 and ERK2 were detected. The relative amount of M1 was quantified (A, lower panel). Relative M1 densities are expressed as mean ±SD of three independent experiments. (B) Cells were infected with FPV (MOI = 0.5, left panel) or PR8 (MOI = 0.1, right panel) for 8 h; upon the attachment period an acidic wash (PBS-HCl, pH 5.5) was included. Progeny virus titers were determined by standard plaque assays. Data represent mean values of at least three independent experiments ±SD. Statistical significance was assessed by student's t-test (*) p<0.05. In WB analysis EGFR expression level of uninfected cells was detected. (C, D) NIH3T3 wild-type (wt) and NIH3T3 EGFR expressing (HER14) cells were incubated with (C) EGF (30 ng ml−1, 10 min, 37°C) or (D) were infected with PR8 (MOI = 4) for the indicated times. Upon infection an acidic wash (PBS, pH 1.3, 4°C) was performed before cell-lysis. WBs were probed with the indicated antibodies (pEGFR (Y1068) is the autophosphorylation site in the EGFR at tyrosine 1068). (E) NIH3T3 wild-type (wt) and NIH3T3-Her14 (HER14) cells were infected with PR8 and FPV (MOI = 1) for the indicated times. Upon the attachment period an acidic wash (PBS-HCl, pH 5.5) was included. Progeny virus titers were determined by standard plaque assays. Data represent mean values of three independent experiments ±SD. See also Figure S2.
Figure 3
Figure 3. EGFR knock-down impairs efficient uptake of IAV into A549 cells.
(A) A549 cells were treated with an EGFR-specific antibody (5 µg ml−1) or mouse serum at the indicated times before and during infection with FPV (MOI = 0.5) for 8 h. Progeny virus titers were determined by standard plaque assays; virus yields of serum treated cells were arbitrarily set as 100%. Calculation of virus titers revealed 5.65×10⁵ PFU ml−1 (±1.2×10⁵) for -30 min pre-incubation, 10×105 PFU ml−1 (±1×10⁵) for anti EGFR- and for serum pre-incubation. Statistical significance was assessed by student's t-test (*) p<0.05. (B, C) A549 cells were transfected with a control siRNA or a specific siRNA targeting the EGFR. 48 h post transfection cells were infected with (B) PR8 (MOI = 4) for 30 min or (C) PR8 or FPV (MOI = 4) for 8 h. (C) Upon the attachment period an acidic wash (PBS-HCl, pH 5.5) was included. (D, E) A549 cells were incubated with EGF (100 ng ml−1) 90 min before infection with (D) PR8 (MOI = 4) for 30 min or (E) PR8 or FPV (MOI = 4) for 8 h. (B, D) Before cell-lysis an acidic wash (PBS-HCl, pH 1.3, 4°C) was performed and cell-lysates were analysed in WB. Relative M1 densities are expressed as mean ±SD of three independent experiments. (C, E) Progeny virus yields were determined by standard plaque assays. Data represent mean values of three independent experiments ±SD. Statistical significance was assessed by student's t-test (*) p<0.05. EGFR knock-down was verified by WB before infection (C and E, lower panels). Cells were transiently transfected with an EGFR construct during RNAi mediated knock-down (B) or 24 h prior to EGF induced EGFR degradation (D). See also Figure S1 and S2.
Figure 4
Figure 4. The RTK c-Met is involved in IAV internalization.
(A, B) A549 cells were incubated with a c-Met kinase inhibitor (50 µM) at 37°C over night or (C, D) were transfected with control or c-Met specific siRNA 48 h prior to infection. Internalized influenza virus particles were visualized as described in Figure 1B upon infection with the influenza virus strain PR8 (A) (MOI = 8) or (C) (MOI = 4). Progeny virus titers were determined 8 h upon infection with the influenza A virus strain FPV (B, D) (MOI = 4). Data represent mean values of three independent experiments ±SD. Statistical significance was assessed by student's t-test (*) p<0.05, c-Met knock-down was verified by WB before infection (D, lower panel). (E) A549 cells were transfected either with a control siRNA or with specific siRNAs against c-Met and EGFR, as indicated 48 h prior to infection. Progeny virus titers were determined 8 h upon infection with FPV or PR8 (MOI = 4). Data represent mean values of three independent experiments ±SD. Statistical significance was assessed by student's t-test (*) p<0.05, (**) p<0.005. EGFR and c-Met knock-down was verified by WB before infection (E, lower panels). (F) A549 cells were treated with an inhibitor mix containing the indicated RTK inhibitors (each 10 µM, see experimental procedures) or the solvent control (DMSO) 16 hours prior to infection at 37°C. Subsequently cells were infected with FPV (MOI = 4) for 8 h and progeny virus titers were determined. Data represent mean values of three independent experiments ±SD. Statistical significance was assessed by student's t-test (*) p<0.05.
Figure 5
Figure 5. Attachment of IAV clusters plasma-membrane lipids.
(A, B) A549 cells were infected with FPV (MOI = 100), stimulated with EGF (100 ng ml−1) or left untreated for 1 h at 4°C. Subsequently cells were incubated with the FITC-conjugated Choleratoxin beta subunit (CtxB) (30 µg ml−1) for 1 h at 4°C to visualize ganglioside M1 (GM1). (B) FPV was visualized by detection of HA via an HA-specific rabbit antiserum and an Alexa 594-conjugated chicken anti-rabbit IgG (right panel) or via an H7-HA-specific mouse antiserum and a Texas-Red conjugated goat anti-mouse IgG (middle panel). EGFR was detected by an EGFR-specific mouse antiserum followed by a Texas-Red conjugated goat anti-mouse IgG (left panel) or a Alexa 488-conjugated chicken anti-mouse IgG (right panel). For co-patching analysis CtxB was cross-linked by a rabbit antiserum against CtxB. Cells were examined by confocal laser scanning-microscopy. The colocalization was quantified as described in the experimental procedure section. (C, D, E) A549 cells were incubated with methyl-β-cyclodextrin (MCD) (40 µg ml−1) for 1 h at 37°C and subsequently washed with PBS to withdraw MCD. (C) Cells were stained for GM1 with FITC-conjugated CtxB for 1 h at 4°C and subsequently incubated with rabbit antiserum against CtxB. (D) Cells were infected with PR8 (MOI = 4) for 1 h at 37°C; an acidic wash (PBS-HCl; pH 1.3, 4°C) was performed. In WB analysis M1 and ERK2 were detected. Relative M1 densities are expressed as mean values ±SD of at least three independent experiments. (E) Cells were infected with FPV or PR8 (MOI = 4); upon the attachment period an acidic wash (PBS-HCl, pH 5.5) was performed. Progeny virus titers were determined by plaque assays. Data represent mean values of three independent experiments ±SD. Statistical significance was assessed by student's t-test (*) p<0.05, (**) p<0.005.
Figure 6
Figure 6. IAV attachment induces EGFR endocytosis.
(A) Upon treatment with sialidase (± sialidase; 0.01 units ml−1, 3 h, 37°C), A549 cells were infected with FPV (MOI = 100) or were stimulated with EGF, each for 1 h at 4°C and 30 min at 37°C. An EGFR-specific mouse antiserum and Alexa 488-conjugated chicken anti-mouse IgG as well as a HA-specific rabbit antiserum and an Alexa 594-conjugated chicken anti-rabbit IgG were employed. Cells were examined by IF microscopy. (B, C) A549 cells were infected with FPV (MOI = 100) or (B) incubated with EGF (30 ng ml−1) for 1 h at 4°C upon treatment with sialidase (± sialidase; 0.01 units ml−1, 3 h, 37°C). After a temperature shift cells were further kept at 37°C for the indicated times. (B) Surface resident EGFR was detected by FACS analysis. Fluorescence of uninfected/-stimulated cells was arbitrarily set as 100%. (C) After an acidic wash (PBS-HCl, pH 1.3), cells were permeabilized with saponin (0.2% w/v). Infected cells were assessed by detection of viral HA in FACS analysis. (D, E, F, G) A549 cells were transfected with a control or specific siRNAs targeting caveolin-1 (CAV-1) or clathrin heavy chain (CHC). (D) 48 h post transfection, knock-down was verified by WB using the indicated antibodies. (E, F) upon knock-down cells were (E) infected with FPV or (F) incubated with EGF as described in (B), without sialidase treatment. Cell surface EGFR was detected as mentioned in (B). (G) FPV internalization upon knock-down of the indicated proteins was analysed as described in (C).
Figure 7
Figure 7. EGFR kinase activity is induced upon viral attachment and is required for efficient IAV internalization.
(A) A549 cells were incubated with PD153035 (2.8 µM) or DMSO for 1 h at 37°C and were subsequently treated for 10 min with EGF (30 ng ml−1). PI3K dependent Akt phosphorlyation (pAktS473) and phosphorylated EGFR (pEGFRY1068) were detected by WB. (B) A549 cells were mock infected [−] or infected with FPV (MOI = 100) [+] for the indicated times at 37°C. In (C and E) cells were treated with sialidase (± sialidase; 0.01 units ml−1, 3 h, 37°C), and inoculated with PR8 (MOI = 100) for 1 h at 4°C. Subsequently cells were incubated at 37°C for the indicated times. (C, lower panel) The amount of pEGFR(Y1068) was quantified. Relative pEGFR(Y1068) densities are expressed as mean ±SD of three independent experiments. (D, G) A549 cells were infected with PR8 (MOI = 4) for 30 min upon pre-treatment with (D) an EGFR inhibitor (10 µM), or (G) PD153035 (2.8 µM) or DMSO for 1 h at 37°C. (E) EGFR was immuno-precipitated. Co-immunoprecipitated p85 and the input-control was analysed in WB. (F) Cells were stimulated with EGF (30 ng ml−1) 10 min prior to infection and infected with PR8 (MOI = 4) for 30 min at 37°C; an acidic wash (PBS; pH 1.3, 4°C) was performed. WBs were probed with the indicated antibodies. (H) Biotinylated Sambucus nigra agglutinin (SNA) or Maackia amurensis agglutinin II (MAAII) (1 µg ml−1) were incubated for 60 min at 4°C with A549 cells. Subsequently cells were either incubated at 37°C for 30 min and lysed for detection of pEGFR(Y1068) levels by WB or incubated with Cy3-conjugated streptavidin to detect lectins for fluorescence microscopy (scale bar 10 µm). See also Figure S3.
Figure 8
Figure 8. Model for the RTK-mediated internalization of IAV.
In unstimulated cells, RTKs are localized in GM1 positive lipid rafts at the plasma membrane. Multivalent binding of viral HA to sialic acids at RTKs or GM1 leads to the aggregation of rafts, resulting in the concentration and clustering of RTK. Intrinsic kinase activity of RTKs is triggered in response to clustering. This leads to signal induction and presumably to the onset of endocytosis of the RTKs, which facilitates IAV internalization.

Similar articles

Cited by

References

    1. Lakadamyali M, Rust MJ, Zhuang X. Endocytosis of influenza viruses. Microbes Infect. 2004;6:929–936. - PMC - PubMed
    1. Lakadamyali M, Rust MJ, Zhuang X. Ligands for clathrin-mediated endocytosis are differentially sorted into distinct populations of early endosomes. Cell. 2006;124:997–1009. - PMC - PubMed
    1. Chu VC, Whittaker GR. Influenza virus entry and infection require host cell N-linked glycoprotein. Proc Natl Acad Sci U S A. 2004;101:18153–18158. - PMC - PubMed
    1. Kunzelmann K, Beesley AH, King NJ, Karupiah G, Young JA, et al. Influenza virus inhibits amiloride-sensitive Na+ channels in respiratory epithelia. Proc Natl Acad Sci U S A. 2000;97:10282–10287. - PMC - PubMed
    1. Pleschka S, Wolff T, Ehrhardt C, Hobom G, Planz O, et al. Influenza virus propagation is impaired by inhibition of the Raf/MEK/ERK signalling cascade. Nat Cell Biol. 2001;3:301–305. - PubMed

Publication types

MeSH terms