. 2010 Sep 9;6(9):e1001100.
doi: 10.1371/journal.ppat.1001100.

High content phenotypic cell-based visual screen identifies Mycobacterium tuberculosis acyltrehalose-containing glycolipids involved in phagosome remodeling

Affiliations

High content phenotypic cell-based visual screen identifies Mycobacterium tuberculosis acyltrehalose-containing glycolipids involved in phagosome remodeling

Priscille Brodin et al. PLoS Pathog. .

Abstract

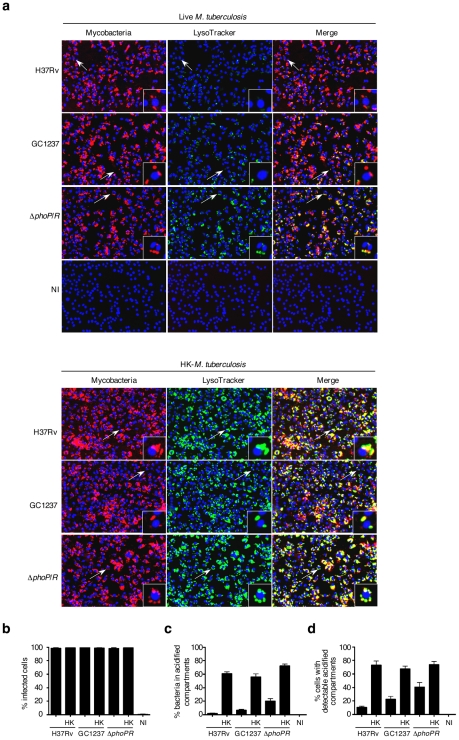
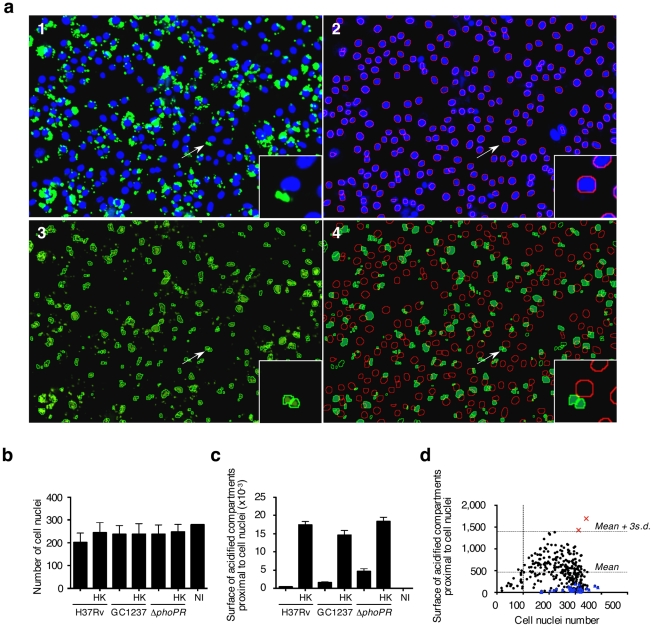
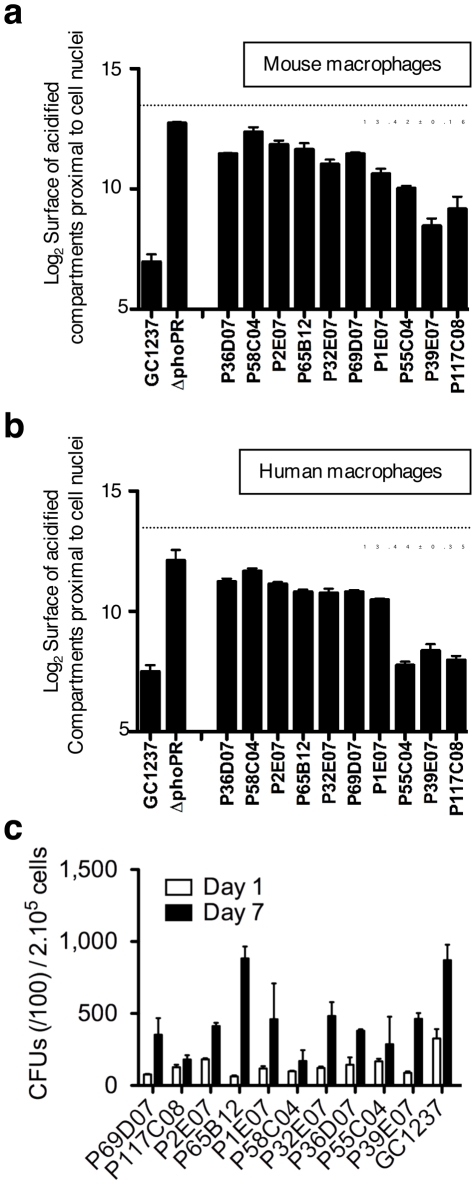
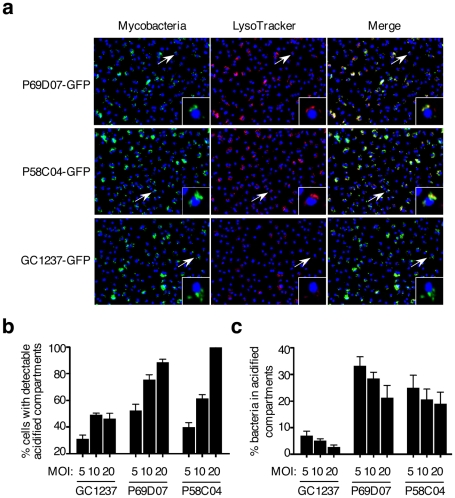
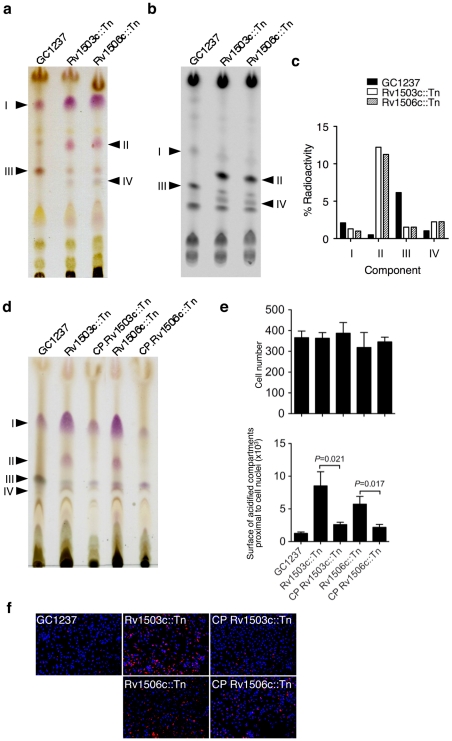
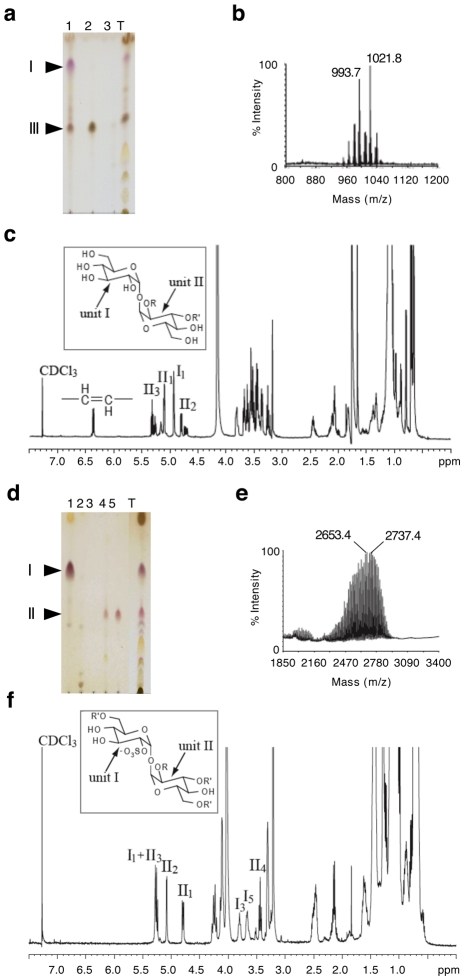
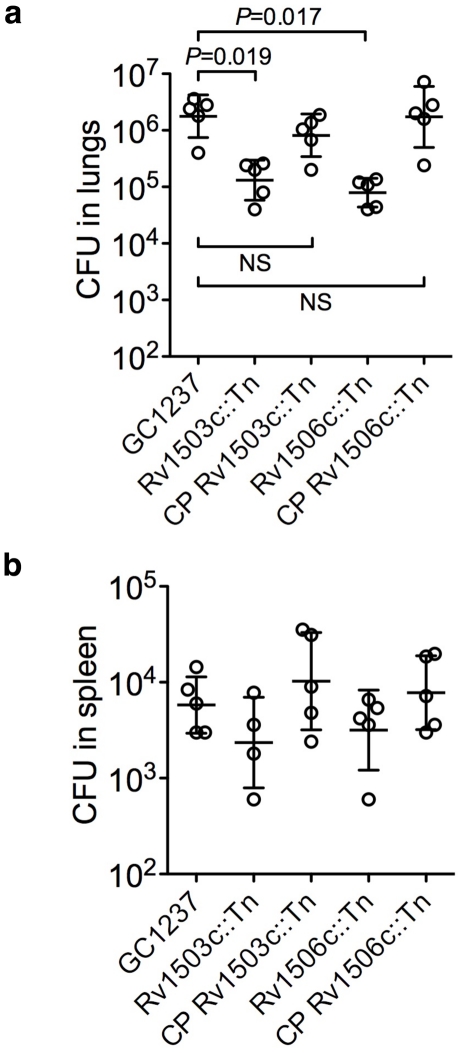
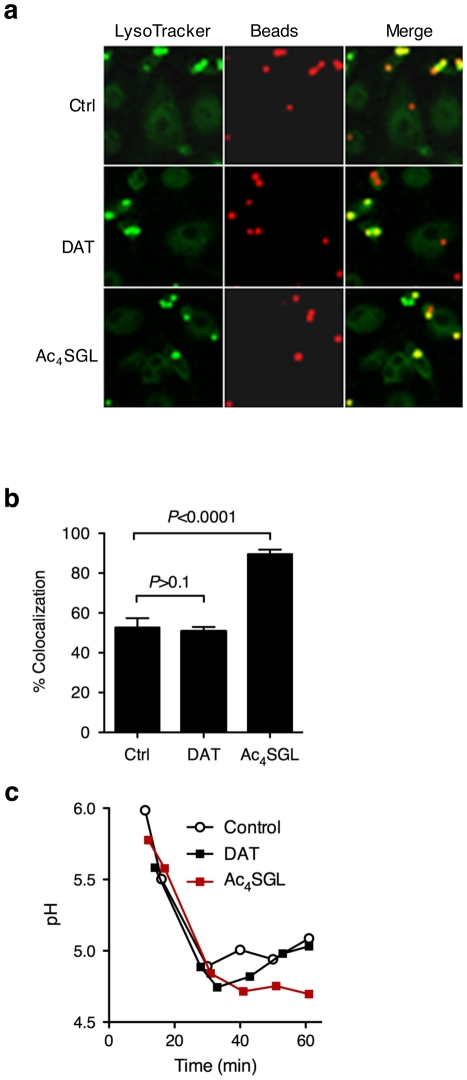
The ability of the tubercle bacillus to arrest phagosome maturation is considered one major mechanism that allows its survival within host macrophages. To identify mycobacterial genes involved in this process, we developed a high throughput phenotypic cell-based assay enabling individual sub-cellular analysis of over 11,000 Mycobacterium tuberculosis mutants. This very stringent assay makes use of fluorescent staining for intracellular acidic compartments, and automated confocal microscopy to quantitatively determine the intracellular localization of M. tuberculosis. We characterised the ten mutants that traffic most frequently into acidified compartments early after phagocytosis, suggesting that they had lost their ability to arrest phagosomal maturation. Molecular analysis of these mutants revealed mainly disruptions in genes involved in cell envelope biogenesis (fadD28), the ESX-1 secretion system (espL/Rv3880), molybdopterin biosynthesis (moaC1 and moaD1), as well as in genes from a novel locus, Rv1503c-Rv1506c. Most interestingly, the mutants in Rv1503c and Rv1506c were perturbed in the biosynthesis of acyltrehalose-containing glycolipids. Our results suggest that such glycolipids indeed play a critical role in the early intracellular fate of the tubercle bacillus. The unbiased approach developed here can be easily adapted for functional genomics study of intracellular pathogens, together with focused discovery of new anti-microbials.


Conflict of interest statement

The authors have declared that no competing interests exist.

Figures

Figure 1
Figure 1. Quantification of M. tuberculosis intracellular trafficking into acidified compartments by automated confocal imaging.
(a) Representative pictures of mouse bone-marrow-derived macrophages infected with CypHer5 (red)-labeled M. tuberculosis H37Rv, GC1237, or GC1237-derived ΔphoP/R mutant, or heat-killed (HK) bacteria. After 2 hours of infection, cells were stained with LysoTracker DND-26 (green) and DAPI (blue) for acidic compartments and cell nuclei labeling, respectively. Non-infected macrophages (NI) are shown as control. Images span 0.450×0.340 mm2. Arrows indicate cells shown at higher magnification in the insets. (b-d) Percentage of infected cells, bacteria inside LysoTracker-positive acidified compartments, and cells with LysoTracker-positive compartments. Values for each condition are the average ± s.d. determined for seven different infections for which four fields were recorded and analyzed, and are representative of two independent experiments.
Figure 2
Figure 2. Phenotypic cell-based genetic screen.
(a) Mouse bone marrow-derived macrophages were infected with HK-M. tuberculosis H3Rv. Image analysis. 1: Typical 2-color image of LysoTracker (green)- and DAPI (blue)-stained infected cells; 2: Red-circled blue objects correspond to detected cell nuclei from the blue channel image; 3: Green-circled green objects correspond to detected acidic compartments from the green channel image; 4: Green-filled surfaces correspond to acidic compartments detected as being proximal to red-circled cell nuclei. Images span 0.450×0.340 mm2. (b,c) Image-based quantification of the cell nuclei number and the total acidic compartment surface proximal to cell nuclei. Values for each condition are the average ± s.d. determined for seven different infections for which four fields were recorded and analyzed, and are representative of three independent experiments and of controls from each 384-well screening microplates. Abbreviations are as in Figure 1. (d) Library screening. Automated confocal imaging-based analysis of a selected microplate containing mouse bone marrow-derived macrophages infected for 2 h with a subset of the M. tuberculosis GC1237-derived mutant library (black dots & red squares), or left uninfected (blue triangles), and subsequently labeled with LysoTracker. Red crosses correspond to two hit mutants selected from this particular microplate.
Figure 3
Figure 3. Phenotypic cell-based assay identifies 10 M. tuberculosis mutants that rapidly traffic into acidified phagosomes.
Mouse bone marrow- (a) and human monocyte- (b) derived macrophages were infected for 2 h with the various mutants at a multiplicity of infection (MOI) of 10 bacteria per cell, stained with LysoTracker and subsequently analyzed by confocal imaging. Cells infected with M. tuberculosis GC1237, heat-killed (HK)-GC1237 or with the ΔphoPR mutant are shown as controls. Values for each condition are the average ± s.d. determined for three different infections for which four fields were recorded and analyzed, and are representative of two independent experiments. The dotted lines and the numbers below the lines indicate values for HK-bacteria. (c) Intracellular survival ability of the mutants. Mouse bone marrow-derived macrophages were infected with the mutant and wild type strains at a MOI of 1 bacterium per cell. CFUs were scored 1 and 7 days after infection. The bars for each condition are the mean ± s.d of a triplicate experiment.
Figure 4
Figure 4. M. tuberculosis mutants #1 and #6 traffic rapidly to acidified vacuoles.
(a) Confocal microscopy analysis of LysoTracker (red)-stained mouse bone marrow-derived macrophages infected for 2 h with GFP-expressing M. tuberculosis #1 and #6 mutants and GC1237. Images span 0.450×0.340 mm2. (b,c) Image-based quantification of bacteria inside LysoTracker-positive acidic compartments, and cells with LysoTracker-positive acidic compartments for different multiplicities of infection (MOI). Values for each condition are the average ± s.d. determined for three different infections for which four fields were recorded and analyzed, and are representative of two independent experiments.
Figure 5
Figure 5. Lipid content and phenotype of the M. tuberculosis GC1237 wild-type, Rv1503c::Tn and Rv1506c::Tn mutants, and complemented strains.
(a,b) anthrone-stained (a) and autoradiogram (b) of thin-layer chromatography of [1-14C]propionate labelled lipids (20000 cpm/lane). (c) Quantification of the lipids from (b). One representative out of four experiments is shown. (d) TLC analysis of the lipids of cosmid-complemented strains vs wild-type and mutant strains. (e,f) Trafficking phenotype of the wild-type, mutant and complemented strains. Representative pictures of mouse bone-marrow-derived macrophages infected with M. tuberculosis GC1237, Rv1503c::Tn and Rv1506c::Tn mutants, and complemented strains. After 2 hours of infection, cells were stained with LysoTracker DND-99 (red) and DAPI (blue) for acidic compartments and cell nuclei labeling, respectively. In (a), lipids were subjected to TLC with CHCl3/CH3OH/H2O 30/8/1 (v/v/v) as the solvent; in (b) and (d), lipids were subjected to TLC with CHCl3/CH3OH/H2O 35/8/1 (v/v/v) as the solvent.
Figure 6
Figure 6. Identification of lipids II and III as Ac4SGL and DAT respectively.
(a,d) TLC analysis of fractions from an anion exchange column loaded with total chloroform extract (T) eluted with CHCl3 (1), CHCl3/CH3OH 9/1 (2), CHCl3/CH3OH/H2O 60/35/8 (3), chloroform/methanol 1/2 containing 0.1 M ammonium acetate (4), chloroform/methanol 1/2 containing 0.3 M ammonium acetate (5). In (a), lipids were extracted from the GC1237 strain. In (d), lipids were extracted from the Rv1506c mutant strain. (b,e) MALDI-MS spectra of DAT and Ac4SGL, respectively. The spectrum of DAT was recorded in positive mode while the spectrum of Ac4SGL was recorded in negative mode. (c,f) 1D 1H NMR spectra (∂ 1H: 0-7.5) of DAT and Ac4SGL, respectively. I1 stands for proton 1 of unit I. The characteristic protons are interpreted on the figure. Insets in (c) and (f) show the structure of DAT and Ac4SGL, respectively. R corresponds to palmitic or stearic acids while R' corresponds to polymethyl-branched fatty acid. The two glucose units are labeled I and II.
Figure 7
Figure 7. Virulence of the Rv1503c::Tn, Rv1506c::Tn mutant and complemented (CP) strains in vivo.
Balb/c mice were infected with 102 CFUs of the different strains via the intranasal route. After 42 days of infection, mice were sacrificed, and the lungs (a) and spleen (b) homogenized and plated onto agar medium for CFU determination. Each circle represents one animal, and the bars indicate means ± s.d. Differences in the spleen samples were not significant. No differences in the lungs 20 days after infection were observed (not shown).
Figure 8
Figure 8. Effect of purified DAT and Ac4SGL on intracellular trafficking of silica beads in human macrophages.
(a) Human monocyte-derived macrophages were pulsed for 15 min with 3-µm silica beads (3-5 beads per cell) coated with BSA-alexa Fluor 647 conjugate (red) and with Ac4SGL or DAT. Control beads (ctrl) are not coated with lipids. Cells were chased for 70 min in bead-free medium containing 250 nM LysoTracker Green DND-26 to follow phagosome acidification (green). Cells were fixed and immediately examined under the confocal microscope. (b) Phagosome acidification was measured by recording colocalization between the red and the green signals in about 100 phagosomes in 5 independent fields. Data are expressed as mean % of colocalization (+/- s.d.) and are representative of two independent experiments. Data were analyzed using the Student's t-test. (c) Dynamic pH measurement of phagosomes coated with DAT, Ac4SGL, and control phagosomes in human macrophages over a 1 h phagocytosis-period. Beads were coated with BSA-FITC and -Alexa 647, and the different lipids, and incubated with human monocyte-derived macrophages for various periods of time (up to one hour). Dual fluorescence was recorded, and the ratio FLFITC/FL647 was used to calculate the pH values of the phagosomes. A standard curve was constructed after recording the fluorescence values of cells permeabilized and incubated in buffers of defined pH values.

Similar articles

Cited by

References

    1. Russell DG. Mycobacterium tuberculosis: here today, and here tomorrow. Nat Rev Mol Cell Biol. 2001;2:569–577. - PubMed
    1. Vergne I, Chua J, Singh SB, Deretic V. Cell biology of mycobacterium tuberculosis phagosome. Annu Rev Cell Dev Biol. 2004;20:367–394. - PubMed
    1. Russell DG. Phagosomes, fatty acids and tuberculosis. Nat Cell Biol. 2003;5:776–778. - PubMed
    1. Hestvik AL, Hmama Z, Av-Gay Y. Mycobacterial manipulation of the host cell. FEMS Microbiol Rev. 2005;29:1041–1050. - PubMed
    1. Nguyen L, Pieters J. The Trojan horse: survival tactics of pathogenic mycobacteria in macrophages. Trends Cell Biol. 2005;15:269–276. - PubMed

Publication types

MeSH terms