. 2010 Sep 9;5(9):e12631.
doi: 10.1371/journal.pone.0012631.

High viral fitness during acute HIV-1 infection

Collaborators, Affiliations

High viral fitness during acute HIV-1 infection

Alicia Arnott et al. PLoS One. .

Abstract

Several clinical studies have shown that, relative to disease progression, HIV-1 isolates that are less fit are also less pathogenic. The aim of the present study was to investigate the relationship between viral fitness and control of viral load (VL) in acute and early HIV-1 infection. Samples were obtained from subjects participating in two clinical studies. In the PULSE study, antiretroviral therapy (ART) was initiated before, or no later than six months following seroconversion. Subjects then underwent multiple structured treatment interruptions (STIs). The PHAEDRA study enrolled and monitored a cohort of individuals with documented evidence of primary infection. The subset chosen were individuals identified no later than 12 months following seroconversion to HIV-1, who were not receiving ART. The relative fitness of primary isolates obtained from study participants was investigated ex vivo. Viral DNA production was quantified using a novel real time PCR assay. Following intermittent ART, the fitness of isolates obtained from 5 of 6 PULSE subjects decreased over time. In contrast, in the absence of ART the fitness of paired isolates obtained from 7 of 9 PHAEDRA subjects increased over time. However, viral fitness did not correlate with plasma VL. Most unexpected was the high relative fitness of isolates obtained at Baseline from PULSE subjects, before initiating ART. It is widely thought that the fitness of strains present during the acute phase is low relative to strains present during chronic HIV-1 infection, due to the bottleneck imposed upon transmission. The results of this study provide evidence that the relative fitness of strains present during acute HIV-1 infection may be higher than previously thought. Furthermore, that viral fitness may represent an important clinical parameter to be considered when deciding whether to initiate ART during early HIV-1 infection.


Conflict of interest statement

Competing Interests: The authors have declared that no competing interests exist.

Figures

Figure 1
Figure 1. Primers and probes used in this study.
The original sources and sequences of the primers and probes used in this study are summarised. The fluorophores used were FAM and HEX for the HIV-1 LTR and albumin probes, respectively. The quencher used for both probes was TAMRA.
Figure 2
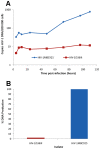
Figure 2. Production of HIV-1 DNA by a reference and a known attenuated virus, quantified using the QPCR assay.
PHA-PBMCs were infected with 6 000 pg of p24 of the reference strain HIV-1MBC925 and known attenuated isolate HIV-1D36III, and cultured for 110 h. Infected cells were harvested at 4, 8, 12, 24, 48, 72, 96 and 110 h post-infection. DNA was extracted and the HIV-1 and albumin DNA quantified using QPCR. Copies of HIV-1 DNA per 200 000 cells, determined for each isolate, are plotted on a logarithmic scale against time (A). In (B), relative fitness of HIV-1D36III was determined by calculating the amount of HIV-1 DNA produced at 96 h post-infection, expressed as a percentage of HIV-1MBC925 DNA production at the same time-point. The results are representative of three experiments.
Figure 3
Figure 3. Viral fitness scores and clinical data for PULSE subjects.
Shown are clinical and experimental data obtained for PULSE subjects from which virus was successfully isolated and subsequently tested using the real time PCR assay. Indicated by the column headings are the subject identification code and seroconversion status at Baseline (‘+’ indicates subject had seroconverted, ‘−’ indicates subject was seronegative, ‘w+’ indicates that a weak antibody response was detected). Also shown are the number of STIs experienced by the subject, whether VL was suppressed below 5 000 RNA copies/ml upon STI (indicated by ‘controller’ or ‘non-controller’), and the phase of the PULSE study during which the relevant sample was collected. The time (in weeks) post Baseline that the sample was collected, coincident VL and CD4+ T cell counts and the sample type from which virus was successfully isolated, are also shown. Finally, viral fitness scores calculated using DNA production measured at 96 h post-infection ex vivo, and at the final time-point analysed (158 h post-infection), are shown for each isolate. The fitness scores generated for the isolate obtained from subject 3.13 were calculated from total HIV-1 DNA produced at 60 and 72 h post-infection. ‘ND’ indicates that the specified measurement was not done.
Figure 4
Figure 4. Decreasing fitness over time observed following analysis of paired isolates obtained from acute HIV-1 infection subjects, measured using QPCR.
Relative viral fitness scores were calculated for isolates obtained from PULSE subjects and represented on a box-plot. Only subjects from whom a Baseline isolate and at least one additional isolate (Week 27 to 106) were obtained were included in the analysis (n = 6). Where multiple isolates from additional time-points were obtained, the average of the combined viral fitness scores was used. Shown are viral fitness scores calculated at the final time-point tested (158 h; exception was 3.13 which was at 72 h) ex vivo for paired isolates obtained from 6 PULSE subjects. The box represents the middle 50% of values for the data set, the solid line indicates the median value. The vertical ‘whiskers’ extending from the box respectively indicate the lowest and highest observed values. The open circle represents an outlier; the asterisk represents an extreme outlier. The significance of the observed changes in viral fitness over time is shown (p = 0.14), calculated using a signed rank test.
Figure 5
Figure 5. Viral fitness did not correlate with VL following analysis of isolates obtained from acute HIV-1 infection subjects.
Coincident plasma VL measurements (log10 RNA copies/ml) were plotted against relative viral fitness scores (log10) for 16 isolates, obtained from plasma, from PULSE subjects. The Pearson correlation was rho = 0.496, p = 0.051.
Figure 6
Figure 6. Clinical and experimental data obtained for PHAEDRA subjects.
Shown are clinical and experimental data obtained for PHAEDRA subjects from which virus was successfully isolated and subsequently tested using the real time PCR assay. Indicated by the column headings are the subject identification code, seroconversion status at Baseline (‘+’ indicates subject had seroconverted, ‘-’ indicates subject was seronegative), and the phase of the PHAEDRA study at which the relevant sample was collected. The time (in weeks) post Baseline that the sample was collected, coincident VL and CD4+ T cell counts, and the sample type from which virus was successfully isolated are shown. The viral fitness scores calculated using DNA production measured at 96 h post-infection ex vivo, and at the final time-point analysed (110 h post-infection), are shown for each isolate.
Figure 7
Figure 7. Increasing viral fitness over time observed following analysis of paired isolates obtained from early chronic HIV-1 infection subjects, measured using QPCR.
Relative viral fitness scores were calculated for isolates obtained from PHAEDRA subjects and represented on a box-plot. Only subjects from whom a Baseline isolate and at least one additional isolate (Week 36 to 52) were obtained were included in the analysis (n = 8). Shown are viral fitness scores calculated at the final time-point tested (110 h) ex vivo for paired isolates obtained from 8 PHAEDRA subjects. The box represents the middle 50% of values for the data set, the solid line indicates the median value. The vertical ‘whiskers’ extending from the box respectively indicate the lowest and highest observed values. The asterisk represents an extreme outlier. The significance of the observed changes in viral fitness over time is shown (p = 0.03), calculated using a signed rank test.
Figure 8
Figure 8. Viral fitness did not correlate with VL following analysis of isolates obtained from early chronic HIV-1 infection subjects.
Coincident plasma VL measurements (log10 RNA copies/ml) were plotted against relative viral fitness scores (log10) for 16 isolates, obtained from plasma, from PHAEDRA subjects. The Pearson correlation was rho = 0.133, p = 0.697.
Figure 9
Figure 9. Increased fitness of Baseline isolates obtained from acute HIV-1 infection subjects relative to isolates obtained subsequent to Baseline from early chronic HIV-1 infection subjects.
Relative viral fitness scores were calculated for isolates obtained from PULSE and PHAEDRA subjects. Shown on a box-plot are the viral fitness scores generated for the Baseline isolates obtained from 13 PULSE subjects compared with the viral fitness scores of the ‘Late’ isolates obtained from eight PHAEDRA subjects, at 96 h PI (A) and at the final time-point tested (158 h PI for PULSE and 110 h PI for PHAEDRA isolates; B). The box represents the middle 50% of values for the data set; the solid line indicates the median value. The vertical ‘whiskers’ extending from the box respectively indicate the lowest and highest observed values. Outliers are represented by an open circle; extreme outliers are represented by an asterisk. The significance of difference in viral fitness between the two groups at 96 h PI (A; p = 0.12) and the final time-point tested (B; p = 0.45) is shown.
Figure 10
Figure 10. Viral fitness of baseline isolates obtained from acute HIV-1 infection subjects (PULSE) and from early chronic HIV-1 infection subjects (PHAEDRA) relative to the stage of seroconversion as detailed by Fiebig and collegues (24).
Baseline viral fitness scores for both PULSE (orange) and PHAEDRA (mauve) subjects from final timepoints (110 h or 158 h) have been grouped according to the stage of seroconversion (Fiebig stages IV, V or VI; reference 24) for direct comparison.

References

    1. Tebit DM, Nankya I, Arts EJ, Gao Y. HIV diversity, recombination and disease progression: how does fitness “fit” into the puzzle? AIDS Rev. 2007;9:75–87. - PubMed
    1. Mansky LM, Temin HM. Lower in vivo mutation rate of human immunodeficiency virus type 1 than that predicted from the fidelity of purified reverse transcriptase. J Virol. 1995;69:5087–5094. - PMC - PubMed
    1. Chun TW, Carruth L, Finzi D, Shen X, DiGiuseppe JA, et al. Quantification of latent tissue reservoirs and total body viral load in HIV-1 infection. Nature. 1997;387:183–188. - PubMed
    1. Ho DD, Neumann AU, Perelson AS, Chen W, Leonard JM, et al. Rapid turnover of plasma virions and CD4 lymphocytes in HIV-1 infection. Nature. 1995;373:123–126. - PubMed
    1. Perelson AS, Neumann AU, Markowitz M, Leonard JM, Ho DD. HIV-1 dynamics in vivo: virion clearance rate, infected cell life-span, and viral generation time. Science. 1996;271:1582–1586. - PubMed

Publication types

Substances