. 2010 Sep 9;5(9):e12643.
doi: 10.1371/journal.pone.0012643.

Electron tomography of cryofixed, isometrically contracting insect flight muscle reveals novel actin-myosin interactions

Affiliations

Electron tomography of cryofixed, isometrically contracting insect flight muscle reveals novel actin-myosin interactions

Shenping Wu et al. PLoS One. .

Abstract

Background: Isometric muscle contraction, where force is generated without muscle shortening, is a molecular traffic jam in which the number of actin-attached motors is maximized and all states of motor action are trapped with consequently high heterogeneity. This heterogeneity is a major limitation to deciphering myosin conformational changes in situ.

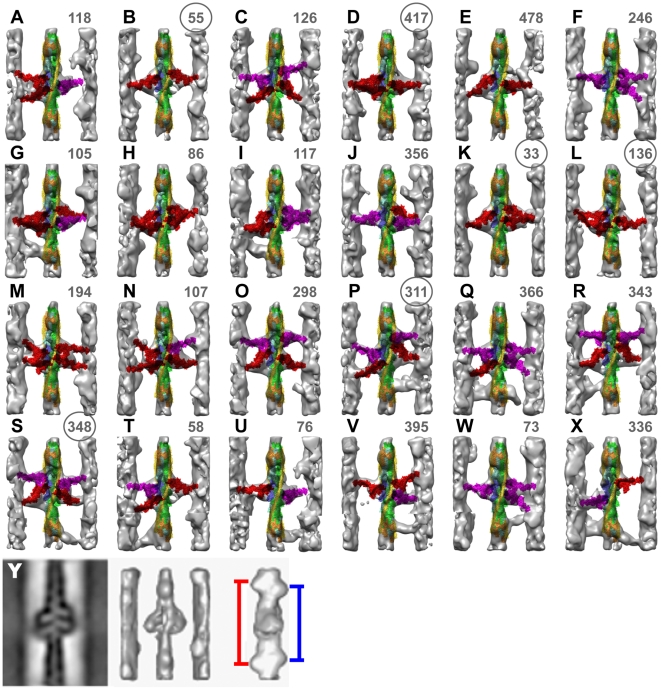
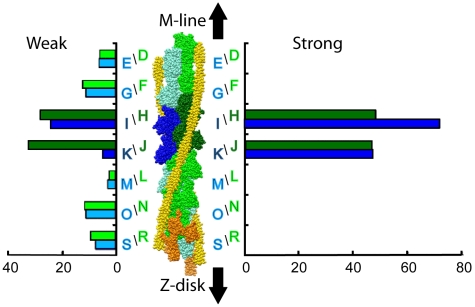
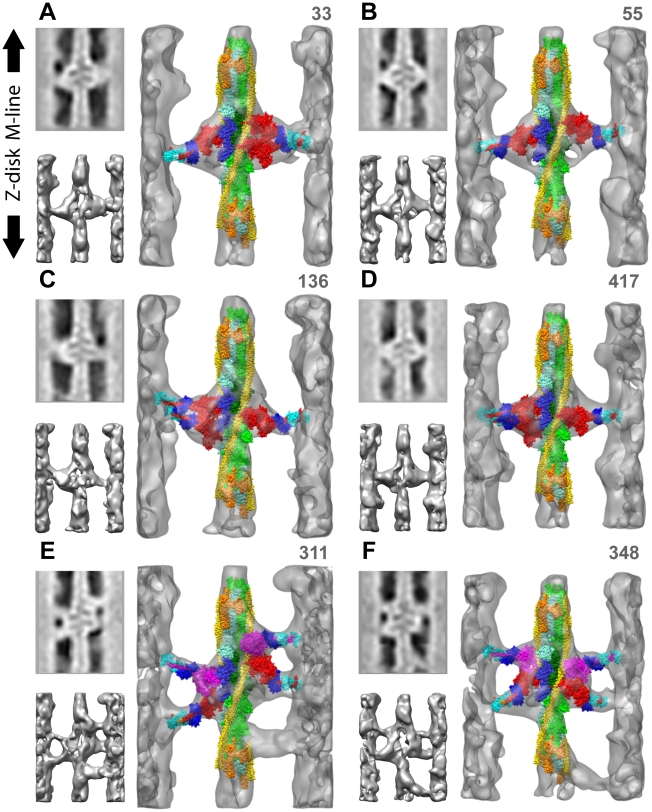
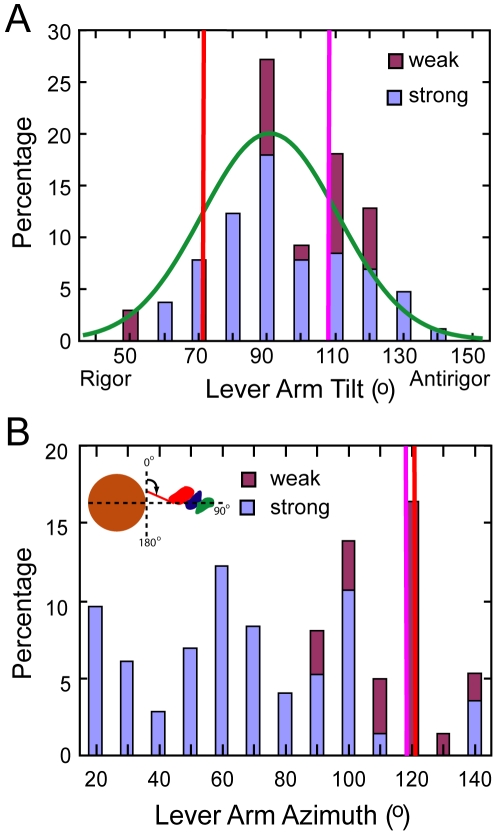
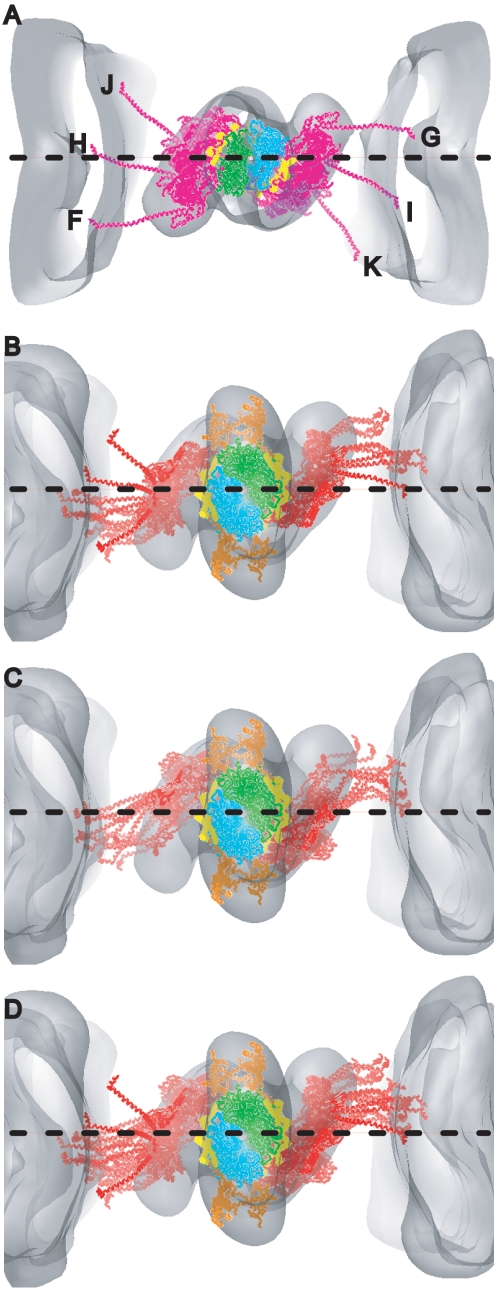
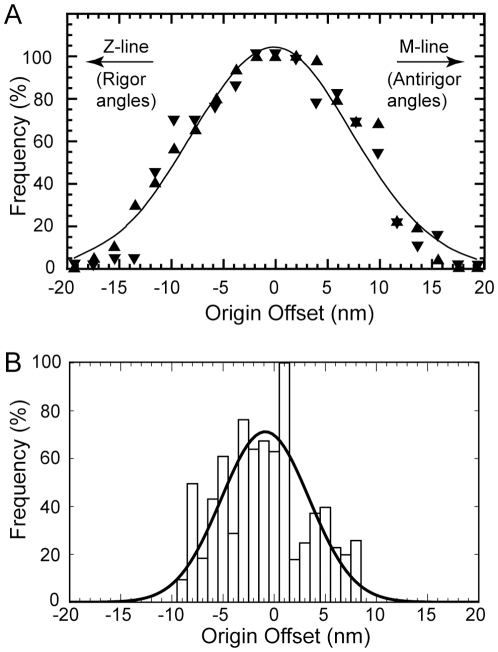
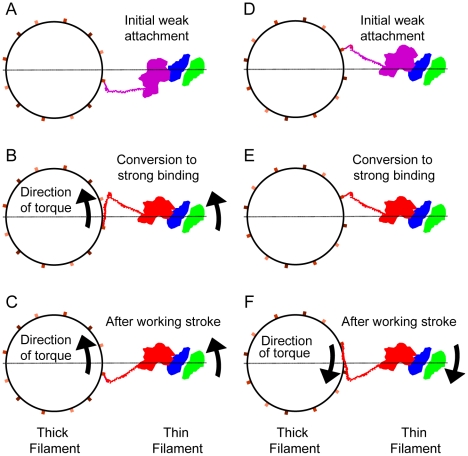
Methodology: We used multivariate data analysis to group repeat segments in electron tomograms of isometrically contracting insect flight muscle, mechanically monitored, rapidly frozen, freeze substituted, and thin sectioned. Improved resolution reveals the helical arrangement of F-actin subunits in the thin filament enabling an atomic model to be built into the thin filament density independent of the myosin. Actin-myosin attachments can now be assigned as weak or strong by their motor domain orientation relative to actin. Myosin attachments were quantified everywhere along the thin filament including troponin. Strong binding myosin attachments are found on only four F-actin subunits, the "target zone", situated exactly midway between successive troponin complexes. They show an axial lever arm range of 77°/12.9 nm. The lever arm azimuthal range of strong binding attachments has a highly skewed, 127° range compared with X-ray crystallographic structures. Two types of weak actin attachments are described. One type, found exclusively in the target zone, appears to represent pre-working-stroke intermediates. The other, which contacts tropomyosin rather than actin, is positioned M-ward of the target zone, i.e. the position toward which thin filaments slide during shortening.

Conclusion: We present a model for the weak to strong transition in the myosin ATPase cycle that incorporates azimuthal movements of the motor domain on actin. Stress/strain in the S2 domain may explain azimuthal lever arm changes in the strong binding attachments. The results support previous conclusions that the weak attachments preceding force generation are very different from strong binding attachments.


Conflict of interest statement

Competing Interests: The authors have declared that no competing interests exist.

Figures

Figure 1
Figure 1. Gallery of reassembled averaged repeats.
Each frame is reassembled from left side, right side and Tn-bridge class averages and corresponds to one individual raw repeat whose number is in the upper right hand corner. Circled numbers indicate repeats that are shown at higher resolution in Figure 3. Strong binding cross-bridges (red) and weak binding cross-bridges (magenta) were assigned from the quasiatomic model building. Each variant of primary and Tn-bridge class averages is represented at least once in this gallery. Some are by necessity represented more than once. (A–F) Predominately single-headed bridges, (G–L) mainly 2-headed cross-bridges, (M–R) contains mask motifs and (S–X) Tn-bridges. (Y) This panel shows the central section (left) of the global average after subvolume alignment, surface view (middle) and rotated surface view to reveal the spacing of Tn densities shown by the blue and red lines. Panel Y taken from reference .
Figure 2
Figure 2. Distributions of myosin heads bound to specific actin subunits on the thin filament.
Weak attachments are shown on the left, and strong attachments on the right. The two actin long pitch strands are colored green and blue with the two target-zone actin subunits colored darker shades of green and blue. Occupancy on target-zone actins H–K was obtained from membership of primary class averages. Occupancy on actins R, S was determined from membership of Tn-bridge classification, while occupancy of actin D–G and L–O was determined from special classifications designed for these particular actins. Occupancy of target-zone actins H–K is plotted in darker shades of green and blue. Actin subunit designations correspond to the chain names in the coordinate files deposited in the Protein Data Bank, PDB – 2w49.
Figure 3
Figure 3. Diversity of myosin-actin attachments shown in quasiatomic models of reassembled primary class averages.
The number in the upper right is the number of the corresponding raw repeat, NOT the number of raw repeats averaged within the class. Small panels to the left are the central section and an opaque isodensity surface view of the larger panel without the quasiatomic model. Actin long pitch strands are cyan and green with the target-zone actins in darker shades, TM is yellow and Tn orange. Strongly bound myosin heads are red, weak binding myosin heads are magenta, The essential light chain is dark blue and the regulatory light chain light blue. (A) shows a single headed cross-bridge on the left and a 2-headed, strong binding cross-bridge on the right. (B) shows a pair of 1-headed, strong-binding cross-bridges on actin subunits H and I. (C & D) have a 2-headed cross-bridge on the left and a 1-headed cross-bridge on the right, all strongly bound to actin. (E & F) are mask motifs with Tn-bridges. In (E) the right side M-ward weak binding cross-bridge is bound outside of the target zone to TM near actin subunit F while the one on the left is within the target zone on actin subunit I. In (F), the weak binding, left-side, M-ward cross-bridge is bound outside the target zone to TM near actin subunit G while the weak binding cross-bridge on the right is bound to target-zone actin subunit H. Tn-bridges have not been fit with a myosin head. These six reassembled repeats can also be viewed in Supporting Movies S1, S2, S3, S4, S5 and S6.
Figure 4
Figure 4. Range of lever arm positions for strongly bound target-zone cross-bridges.
(A) Ribbon diagrams are shown for only the heavy chains of all quasiatomic models (gold) and both starting myosin head structures (red and magenta) as docked onto actin in the strong binding configuration. (B) Plot of the axial angle vrs the azimuthal angle for the data shown in (A). Azimuthal angle measured looking M-line toward Z-line. (C) Plot of axial coordinate versus azimuthal angle for the same data. M-ward indicates the values obtained from myosin heads bound to the two actin subunits H and I at the M-ward end of the target zone; Z-ward indicates values obtained from myosin heads bound to Z-ward actin subunits J and K.
Figure 5
Figure 5. Histogram of lever arm angles for myosin heads bound only to target zone actins.
Values obtained after transforming myosin heads to a single actin subunit, I. Weak binding cross-bridges are aligned to the MD of the scallop transition state initial model. Vertical red and magenta lines indicate the position of the initial models within this coordinate frame. The positions of the lever arms for the starting atomic structures are shown as red and magenta vertical lines. (A) Distribution of lever arm tilt angles computed relative to the filament axis. Angles <90° are rigor-like and angles >90° are antirigor-like. The green curve is a Gaussian fit to the data with µ = 95.7°, σ = 19.8°. The fit for strong binding heads alone (not shown) is µ = 93.4°, σ = 19.5°. (B) Distribution of lever arm azimuths relative to the inter-filament axis. The inset gives the angular convention given a direction of view from M-line toward Z-disk. Red and magenta vertical lines show the azimuths of the starting atomic structures, which are very similar. Clearly, if starting-structure azimuth were the only influence, then the final azimuths in B should center around these vertical lines at 120°, as indeed the weak-binding target-zone bridges tend to do here. Direct Z-ward views of the unexpected azimuthal skewing observed for strong-binding bridges are shown in Figure 6B–C, in contrast to the starting-structure azimuths for target-zone myosin heads shown in Figure 6A. Figure 10 depicts possible torsional effects that might contribute to the skewing.
Figure 6
Figure 6. Models of strong binding bridges superimposed and displayed on their bound actin subunits.
To provide a spatial reference, the models are displayed with the map of the global average. The horizontal dashed line represents the inter-thick-filament axis. All views are looking from the M-line toward the Z-line. (A) Scallop transition state starting model on actin subunits F–K. The S1–S2 junctions are positioned clockwise from the interfilament axis for all starting models on actins H–K. The S1–S2 junctions of starting models on F and G are located anticlockwise from the interfilament axis. However, no strong binding attachments occur on actins F and G. (B) Bridge models strongly bound to M-ward actin subunits H and I. The lever arms of the only two models that fall above the inter-thick-filament axis are bound to actin subunit H and have the appearance of early beginning-working-stroke conformations. (C) Bridge models strongly bound to Z-ward actin subunits J and K. (D) All strong binding models on their bound actin subunits showing azimuthal distribution skewed notably anti-clockwise from hypothetical dispersions centered around starting model positions in A.
Figure 7
Figure 7. Schematic model of the effect of section compression on the angle of the lever arm.
Left illustrates the initial state, prior to sectioning and section compression; right side illustrates the effect of section compression. Top row is the view looking down the filament axis; bottom row is the view looking perpendicular to the filament axis. Color scheme has the thick filament red, thin filament magenta, motor domain blue and lever arm black. The region of the target zone is colored cyan. We assume a worst case scenario, in which the thick and thin filament as well as the myosin motor domain are unaffected by compression and the entire effect is concentrated on the lever arm. Section compression decreases the interfilament spacing with a corresponding increase in section thickness. Widening of the section is assumed to be minimal since the reconstructions are scaled to the axial periodicities. See text for the values obtained from this model.
Figure 8
Figure 8. Composite view of weak binding cross-bridge models.
(A) Axial and azimuthal views of all weak binding cross-bridges aligned on the motor domain of the scallop transition state structure. This view illustrates the variations in lever arm compared with the starting scallop S1 structure. All weak binding bridges were built starting from the scallop transition state atomic structure, which is shown as a magenta colored ribbon diagram. Type 1 bridges are shown in gray and Type 2 bridges in gold, both rendered as chain traces. The single post-rigor conformation is colored light brown. (B) All weak binding cross-bridges superimposed on actin subunit I. This view illustrates the variations in MD position when referred to a single actin subunit. Coloring scheme is the same as for panel A. Note the relatively small axial dispersion of the Type 1 MDs compared to the broad dispersion of the Type 2 MDs.
Figure 9
Figure 9. Probability of target-zone cross-bridge formation as a function of cross-bridge origin.
(A) Data reproduced from Tregear et al. (2004) in which the target zone is assumed to be three actin subunits on one side and two actin subunits on the other. (B) Data from the present study, which includes only target-zone cross-bridges on two actin subunits from each side. Although the Tregear et al. data, which were measured by hand, have an overall Gaussian shape, the present measurements, which are based on quasiatomic model fitting, do not follow a strictly Gaussian distribution. The continuous line is a Gaussian fit with µ −0.86 nm and σ = 4.3 nm.
Figure 10
Figure 10. Two mechanisms to account for azimuthal skewing of lever arms of strongly bound cross-bridges.
(A–C) Conversion from weak-to-strong binding according to Scenario 1. (D–F) Active azimuthal component to the working stroke. View direction is M-line toward Z-line. Myosin is colored either red (strong binding) or magenta (weak binding). Actin subunits are green and blue. Three successive levels of S2 origins are shown in shades of brown that darken with distance from the observer. The lever arm is the line originating on the red (or magenta) MD while S2 is shown as a short segment when oriented nearly parallel with the filament axis and becomes longer when angled with respect to the filament axis. The horizontal line is the inter-filament axis. Arrows show the direction of the torques (not their magnitude) produced during the weak-to-strong transition or as a component of force generation and filament sliding. The direction of thin filament movement during sarcomere shortening is toward the observer. (A & D) Initial weak binding is shown, which in (A) begins away from the strong binding orientation and in (D) begins in the strong binding orientation but with actin binding cleft open. (B) Conversion to strong binding involves diffusion of the MD clockwise on actin which swings the S2 anticlockwise about the thick filament. (C) Force production realigns S2 with the filament axis while bending the lever arm azimuthally. (E) Transition from weak to strong binding involves no change in myosin orientation on actin, just a closing of the actin binding cleft. The lever arm in (D & E) is in the same orientation suggested by the crystal structures. (F) An azimuthal component to the working stroke moves the lever arm clockwise around the thick filament. This figure can be seen as an animated sequence in Supporting File S1.

References

    1. Geeves MA, Holmes KC. The molecular mechanism of muscle contraction. Adv Protein Chem. 2005;71:161–193. - PubMed
    1. Geeves MA, Conibear PB. The role of three-state docking of myosin S1 with actin in force generation. Biophys J. 1995;68:194S–199S; discussion 199S–201S. - PMC - PubMed
    1. Cooke R. The mechanism of muscle contraction. CRC Crit Rev Biochem. 1986;21:53–118. - PubMed
    1. Rayment I, Rypniewsky WR, Schmidt-Bäse K, Smith R, Tomchick DR, et al. Three-dimensional structure of myosin subfragment-1: a molecular motor. Science. 1993;261:50–58. - PubMed
    1. Holmes KC, Angert I, Kull FJ, Jahn W, Schroder RR. Electron cryo-microscopy shows how strong binding of myosin to actin releases nucleotide. Nature. 2003;425:423–427. - PubMed

Publication types

MeSH terms