. 2010 Sep 10;5(9):e12686.
doi: 10.1371/journal.pone.0012686.

Learning priors for Bayesian computations in the nervous system

Affiliations

Learning priors for Bayesian computations in the nervous system

Max Berniker et al. PLoS One. .

Abstract

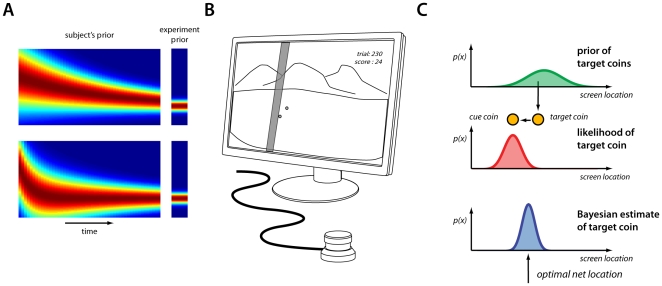
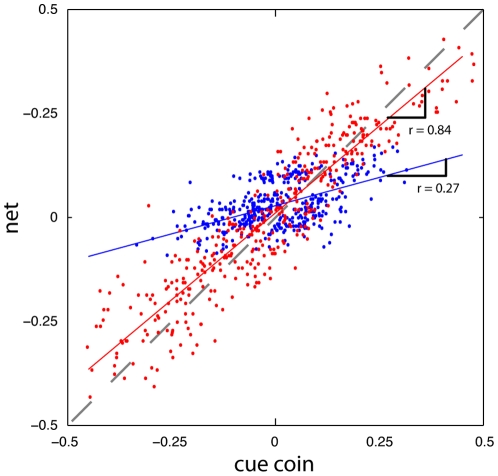
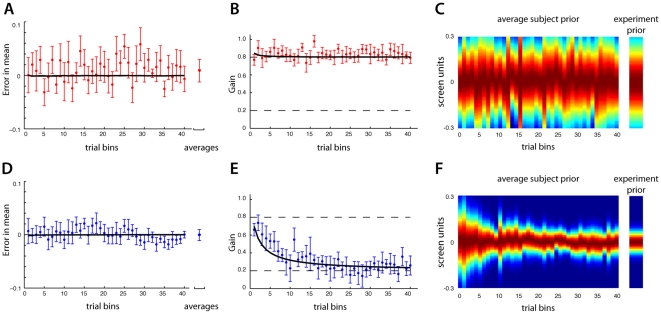
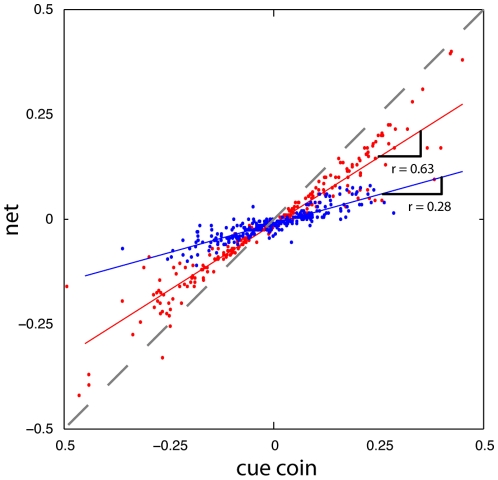
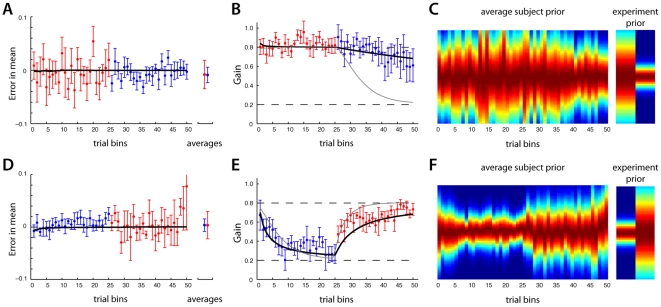
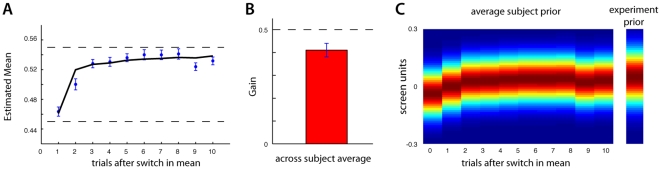
Our nervous system continuously combines new information from our senses with information it has acquired throughout life. Numerous studies have found that human subjects manage this by integrating their observations with their previous experience (priors) in a way that is close to the statistical optimum. However, little is known about the way the nervous system acquires or learns priors. Here we present results from experiments where the underlying distribution of target locations in an estimation task was switched, manipulating the prior subjects should use. Our experimental design allowed us to measure a subject's evolving prior while they learned. We confirm that through extensive practice subjects learn the correct prior for the task. We found that subjects can rapidly learn the mean of a new prior while the variance is learned more slowly and with a variable learning rate. In addition, we found that a Bayesian inference model could predict the time course of the observed learning while offering an intuitive explanation for the findings. The evidence suggests the nervous system continuously updates its priors to enable efficient behavior.


Conflict of interest statement

Competing Interests: The authors have declared that no competing interests exist.

Figures

Figure 1
Figure 1. Illustration of potential learning patterns and overview of experiment.
A) Possible depiction of the subject's estimated prior while they learn both mean and the variance at the same rate (top), or when the learning rate for the variance is slower (bottom), as would be expected from statistical considerations. B) A depiction of the experimental set-up. Coins are displayed on screen and the subjects place a horizontal “net” with a paddle wheel. C) A distribution over coin locations defines the prior, the observed cue coin defines a likelihood for the target coin, and Baye's rule prescribes the optimal posterior distribution of the estimated location of the target coin.
Figure 2
Figure 2. Data from two representative subjects in experiment 1.
For illustrative purposes, the mean of the target coin's prior was removed from the cue coin's positions to center the data. For the subject in group 1A (the red dots), on average the net was placed relatively close to the cue coin (the diagonal represents net  =  cue coin). For the subject in group 1B (the blue dots), on average the net was placed relatively close to the mean of the target coins (far from the diagonal). Linear fits to all 400 trials of the experiment are shown in the solid red and blue lines. The Bayes' optimal slopes are 0.8 and 0.2.
Figure 3
Figure 3. Results from experiment 1.
Group 1A's results (large variance group) are in the top row and group 1B's results (small variance group) are in the bottom row. A), D) The error in the estimated mean of the prior, over the course of the experiment (each bin is 10 consecutive trials) averaged over subjects (mean +/− standard error). The far right point is the average over subjects and trials. B), E) The gain, r, subjects used during the experiment, averaged across subjects. The bold black line indicates the Bayesian inference model's fits to the experimental data. C), F) Inferred average prior as it evolved over the experiment.
Figure 4
Figure 4. Data from a representative subject in experiment 2B.
For illustrative purposes, the mean of the target coin's prior was removed from the cue coin's positions to center the data. During the first half of the experiment the subject was exposed to a prior with a narrow variance (blue dots), and on average, the subject placed the net relatively close to the target coin's mean location (far from the diagonal). In the second half of the experiment the prior's variance was wide and the subject placed the net progressively closer to the cue coin (the red dots). Linear fits to the first 250 trials (blue line) and the last 250 trials (red line) are shown. The Bayes' optimal slopes are 0.8 and 0.2.
Figure 5
Figure 5. Results from group 2.
Group 2A's results (large variance first) are in the top row and group 2B's results (small variance first) are in the bottom row. A), D) The error in the estimated mean of the prior, over the course of the experiment (each bin is 10 consecutive trials) averaged over subjects (mean +/− standard error). The far right is the average over subjects and trials. B), E) The gain, r, subjects used during the experiment, averaged across subjects. The bold black line indicates the Bayesian inference model's prediction for the experimental data. For comparison, the grey line is the prediction of a fixed learning rate linear filter model C), F) Inferred average prior as it evolved over the experiment.
Figure 6
Figure 6. Results from experiment 3.
A) The subject's estimated mean for the prior, locked on the trial the prior switched (averaged across all subjects, and all switches in the prior). The bold black line indicates the inference model's prediction of the same data. B) The subjects measured gain, r (averaged across the first 10 trials after a switch and across all subjects). C) Inferred average prior as it evolved once the prior switched.

References

    1. Weiss Y, Simoncelli EP, Adelson EH. Motion illusions as optimal percepts. Nat Neurosci. 2002;5:598–604. - PubMed
    1. Stocker AA, Simoncelli EP. Noise characteristics and prior expectations in human visual speed perception. Nat Neurosci. 2006;9:578–585. - PubMed
    1. Jacobs RA. Optimal integration of texture and motion cues to depth. Vision Res. 1999;39:3621–3629. - PubMed
    1. Kording KP, Beierholm U, Ma WJ, Quartz S, Tenenbaum JB, et al. Causal inference in multisensory perception. PLoS ONE. 2007;2:e943. - PMC - PubMed
    1. Kording KP, Wolpert DM. Bayesian integration in sensorimotor learning. Nature. 2004;427:244–247. - PubMed

Publication types