. 2010 Sep 2;6(9):e1001093.
doi: 10.1371/journal.pgen.1001093.

Lactic acidosis triggers starvation response with paradoxical induction of TXNIP through MondoA

Affiliations

Lactic acidosis triggers starvation response with paradoxical induction of TXNIP through MondoA

Julia Ling-Yu Chen et al. PLoS Genet. .

Abstract

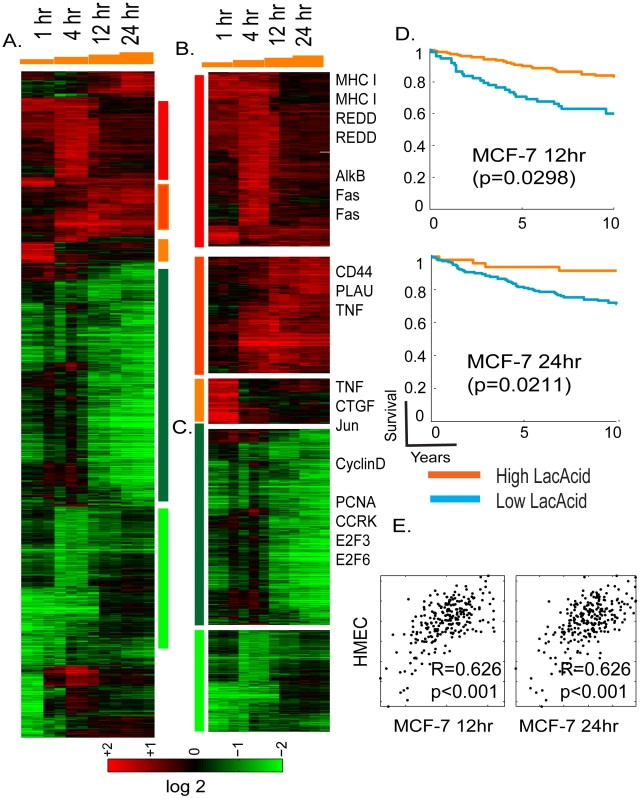
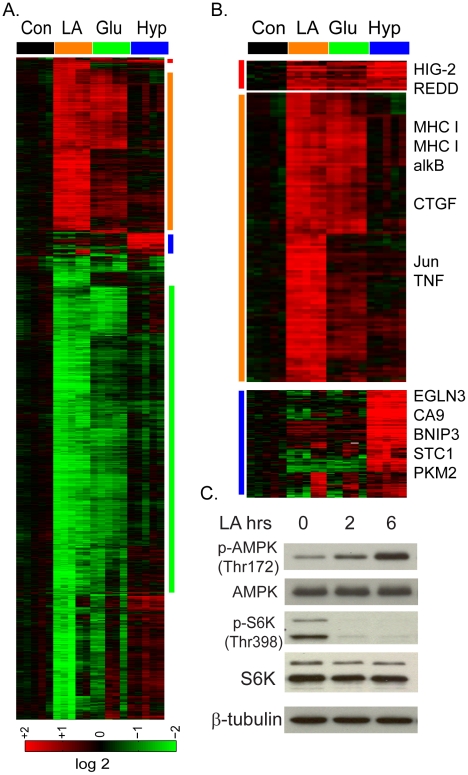
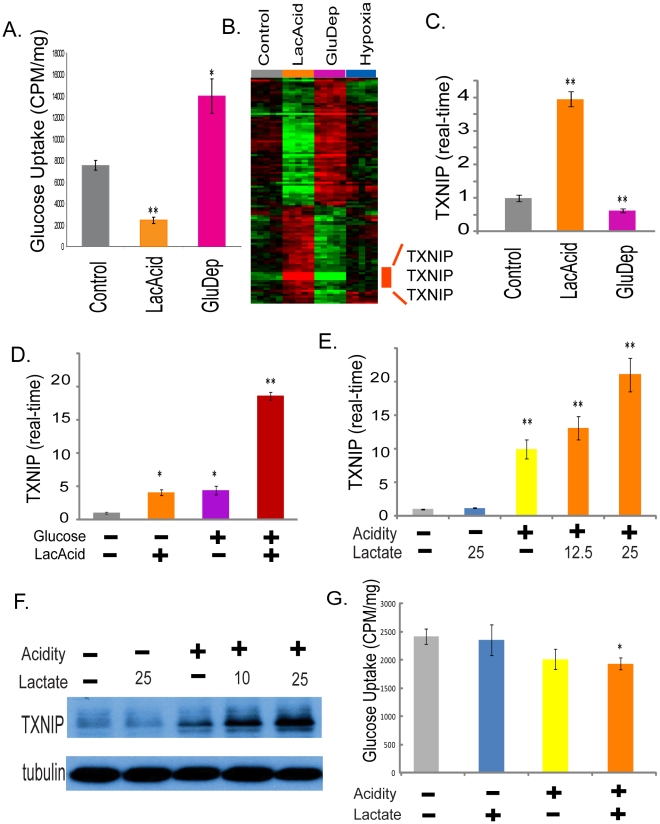
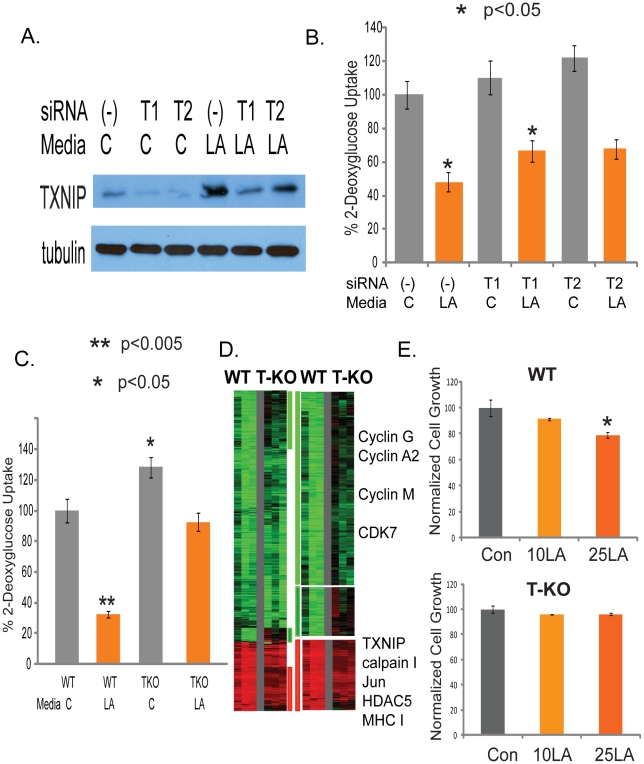
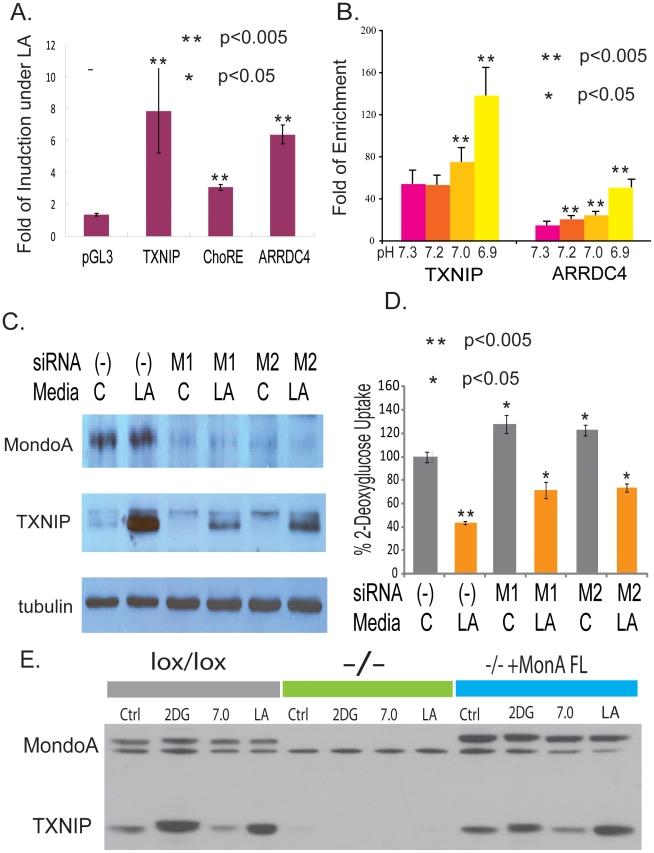
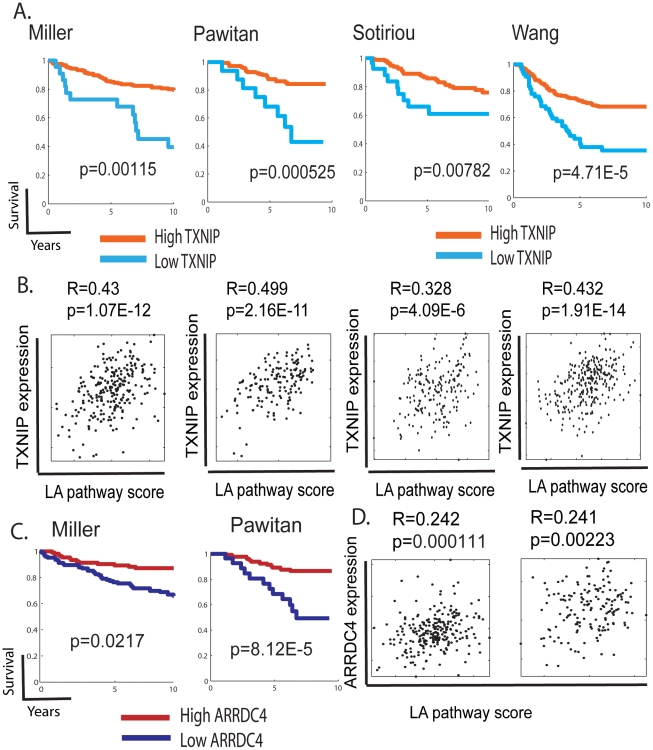
Although lactic acidosis is a prominent feature of solid tumors, we still have limited understanding of the mechanisms by which lactic acidosis influences metabolic phenotypes of cancer cells. We compared global transcriptional responses of breast cancer cells in response to three distinct tumor microenvironmental stresses: lactic acidosis, glucose deprivation, and hypoxia. We found that lactic acidosis and glucose deprivation trigger highly similar transcriptional responses, each inducing features of starvation response. In contrast to their comparable effects on gene expression, lactic acidosis and glucose deprivation have opposing effects on glucose uptake. This divergence of metabolic responses in the context of highly similar transcriptional responses allows the identification of a small subset of genes that are regulated in opposite directions by these two conditions. Among these selected genes, TXNIP and its paralogue ARRDC4 are both induced under lactic acidosis and repressed with glucose deprivation. This induction of TXNIP under lactic acidosis is caused by the activation of the glucose-sensing helix-loop-helix transcriptional complex MondoA:Mlx, which is usually triggered upon glucose exposure. Therefore, the upregulation of TXNIP significantly contributes to inhibition of tumor glycolytic phenotypes under lactic acidosis. Expression levels of TXNIP and ARRDC4 in human cancers are also highly correlated with predicted lactic acidosis pathway activities and associated with favorable clinical outcomes. Lactic acidosis triggers features of starvation response while activating the glucose-sensing MondoA-TXNIP pathways and contributing to the "anti-Warburg" metabolic effects and anti-tumor properties of cancer cells. These results stem from integrative analysis of transcriptome and metabolic response data under various tumor microenvironmental stresses and open new paths to explore how these stresses influence phenotypic and metabolic adaptations in human cancers.


Conflict of interest statement

The authors have declared that no competing interests exist.

Figures

Figure 1
Figure 1. Overview of the time course of lactic acidosis response in MCF-7.
(A) The gene expression response of MCF-7 is shown when exposed to lactic acidosis conditions at indicated time points. 1761 probes sets were selected by the criteria of at least two observations with at least two fold changes and arranged by hierarchical clustering. Clusters of genes induced by different time points and repressed by lactic acidosis are marked and further expanded in (B), and (C) with the names of selected genes shown. (D) The prognostic significance of the lactic acidosis pathway activity in MCF-7 at 12 and 24 hours were assessed in the Miller breast cancer expression dataset. The tumors, stratified by the imputed signature scores associated with the LA response, were used to generate Kaplan-Meier survival curves linking clinical outcomes with the indicated responses. (E) Scatter plots showing the relationship between the estimated lactic acidosis pathway activities using the pathway signature obtained in HMEC (Y-axis) vs. the signature obtained in MCF-7 (X-axis) at 12 and 24 hours. Each point in the scatter plot represents a single tumor from the indicated breast cancer data set. The overall correlation (R) and statistical significance/p-value (p) between the lactic acidosis signature scores elicited in MCF-7 and HMECs across all samples is shown the data set.
Figure 2
Figure 2. The lactic acidosis triggers starvation response.
(A) The transcriptional response of MCF-7 to the lactic acidosis, glucose deprivation and hypoxia at four hours. Selected gene clusters which were induced commonly by lactic acidosis and glucose deprivation and hypoxia, by lactic acidosis and glucose deprivation, or by hypoxia alone were highlighted and expanded in (B) with selected names shown. (C) Lactic acidosis triggers the activation of AMPK (phosphorylation at Thr 172) and the inhibition of mTORC1 as manifested by the reduction of S6K phosphorylation at Thr 398.
Figure 3
Figure 3. The induction of TXNIP under lactic acidosis.
(A) The amount of glucose uptake of the MCF-7 under control, lactic acidosis and glucose deprivation conditions. (B) Heat map shows expression of the 115 selected probe sets in MCF-7 placed in control, lactic acidosis, glucose deprivation and hypoxia for four hours with the probe sets for TXNIP highlighted. (C) The level of TXNIP transcripts determined by real-time PCR in the MCF-7 under indicated conditions. (D) The level of TXNIP transcripts determined by real-time PCR in the MCF-7 under the four indicated conditions for lactic acidosis and glucose level. (E, F) The level of TXNIP determined by real-time PCR (E) and Western blot (F) in the MCF-7 under five indicated conditions with or without acidity (pH 6.7) and carrying levels of lactate (10, 12.5 or 25 mM). (G) The amount of glucose uptake of the MCF-7 under control, acidosis, lactosis (25mM) and lactic acidosis (25mM) conditions.
Figure 4
Figure 4. Identification of TXNIP as a regulator of lactic acidosis response.
(A) The level of TXNIP proteins treated with control or siRNAs against TXNIP under control or lactic acidosis conditions. (B) The level of glucose uptake in the MCF-7 treated with the indicated conditions. Lactic acidosis caused 52% repression of glucose uptake in MCF7 cells transfected with non-targeting siRNAs (-) as negative control. In cells transfected with two different siTXNIPs (T1, T2), glucose uptake was increased and the repressing effect of lactic acidosis was decreased to 39% and 44% respectively. (C) Lactic acidosis caused 68% repression in wild-type (WT) MEF cells but only 28% repression in TXNIP knockout (TKO) MEF cells. (D) The gene expression response of wild type and TXNIP deficient MEF cells was shown when exposed to 10mM lactic acidosis conditions. 1327 probes sets showing with at least 1.7 fold changes in at least two samples were selected and arranged by hierarchical clustering according to similarities in expression patterns. Clusters of genes whose induction and repression was most affected by TXNIP are marked and further expanded with the names of selected genes shown. (E) The effect of the control and lactic acidosis (10mM LA and 25mM LA) on the cell growth in percentage of the wild type and TXNIP deficient MEF cells.
Figure 5
Figure 5. MondoA is responsible for the TXNIP induction under lactic acidosis.
(A) The fold of induction of normalized luciferase activities under lactic acidosis for the indicated reporter constructs driven by wild type TXNIP promoter, TXNIP promoter with the ChoRE mutated and ARRDC4 promoters. (B) The physical binding of MondoA to the promoters of TXNIP and ARRDC4 was assessed by Chromatin-Immunoprecipitation for MCF-7 cells under lactic acidosis with different indicated pH. (C) The level of MondoA and TXNIP proteins in MCF-7 cells treated with control or two siRNAs against MondoA under control or lactic acidosis conditions. (D) The level of glucose uptake in the MCF-7 treated with the indicated conditions. Lactic acidosis caused 57% repression in MCF7 cells transfected with non-targeting siRNA (-). The repression effect of lactic acidosis was decreased to 44% and 40% with MCF7 cells transfected with two different MondoA siRNAs (M1 and M2). (E) The level of MondoA and TXNIP proteins shown by Western in the indicated mouse embryonic fibroblasts (MEF): lox/lox (MEF with wild type MondoA), −/− (lox/lox MEF with cre overexpression to delete MondoA) and −/−+MondoA FL = −/− reconstituted with FL human MondoA under control, 2-DG, pH 7 and lactic acidosis conditions.
Figure 6
Figure 6. The expression of TXNIP, ARRDC4, and lactic acidosis pathways in human cancers.
(A,C) The tumors in the indicated dataset stratified by the expression of TXNIP (A) and ARRDC4 (B) were used to generate Kaplan-Meier survival curves for linking clinical outcomes with the TXNIP expression levels. (B,D) Scatter plots showing the relationship between the expression of TXNIP (B) or ARRDC4 (D) (Y-axis) and predicted lactic acidosis pathway activities based on the MCF-7 12 hour lactic acidosis gene signatures (X-axis) in the indicated tumor datasets. Each point in the scatter plots represents a single tumor from the indicated breast cancer data sets. The overall correlation (R) and statistical significance/p-value (p) across all samples is shown.

References

    1. Vaupel P. Tumor microenvironmental physiology and its implications for radiation oncology. Semin Radiat Oncol. 2004;14:198–206. - PubMed
    1. Warburg O. On respiratory impairment in cancer cells. Science. 1956;124:269–270. - PubMed
    1. Quennet V, Yaromina A, Zips D, Rosner A, Walenta S, et al. Tumor lactate content predicts for response to fractionated irradiation of human squamous cell carcinomas in nude mice. Radiother Oncol. 2006;81:130–135. - PubMed
    1. Brizel DM, Schroeder T, Scher RL, Walenta S, Clough RW, et al. Elevated tumor lactate concentrations predict for an increased risk of metastases in head-and-neck cancer. Int J Radiat Oncol Biol Phys. 2001;51:349–353. - PubMed
    1. Walenta S, Wetterling M, Lehrke M, Schwickert G, Sundfor K, et al. High lactate levels predict likelihood of metastases, tumor recurrence, and restricted patient survival in human cervical cancers. Cancer Res. 2000;60:916–921. - PubMed

Publication types