

Bayesian analysis of genetic interactions in case-control studies, with application to adiponectin genes and colorectal cancer risk
- PMID: 20846215
- PMCID: PMC3005151
- DOI: 10.1111/j.1469-1809.2010.00605.x
Bayesian analysis of genetic interactions in case-control studies, with application to adiponectin genes and colorectal cancer risk
Abstract
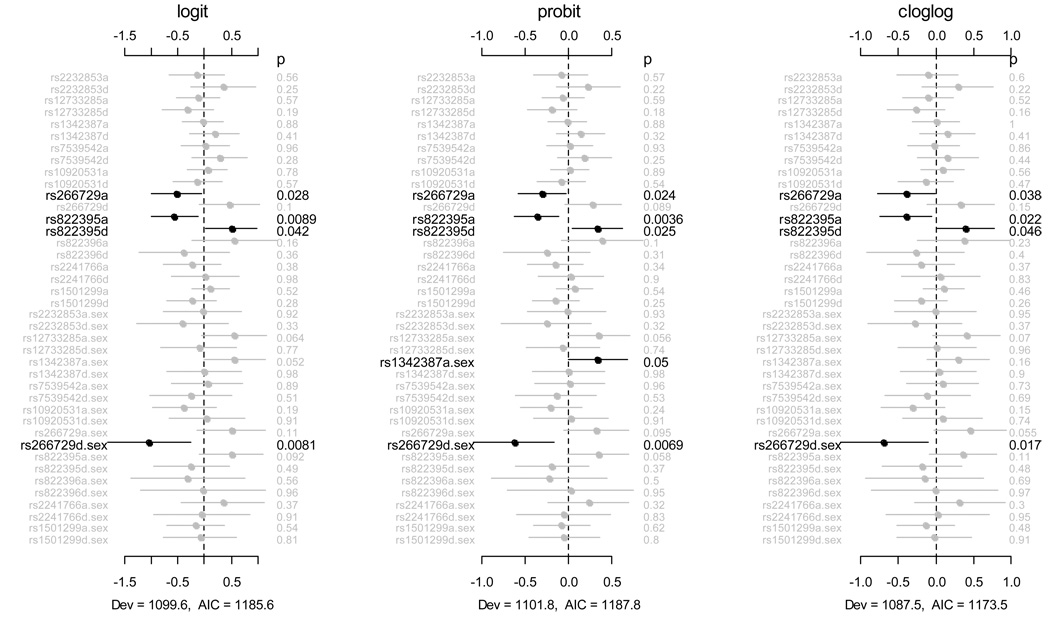
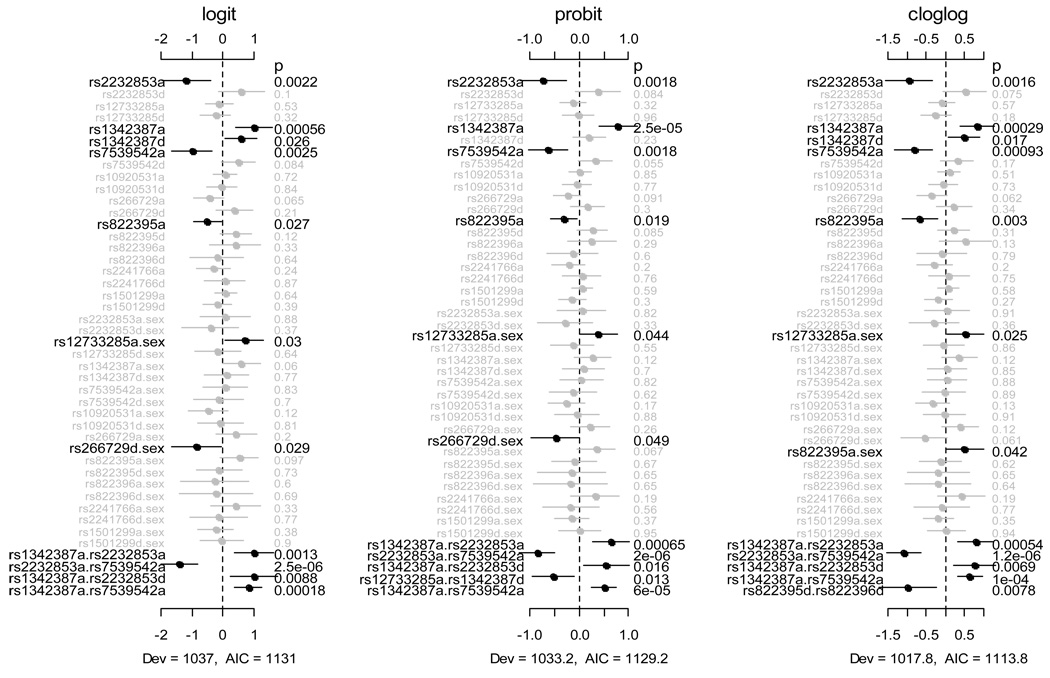
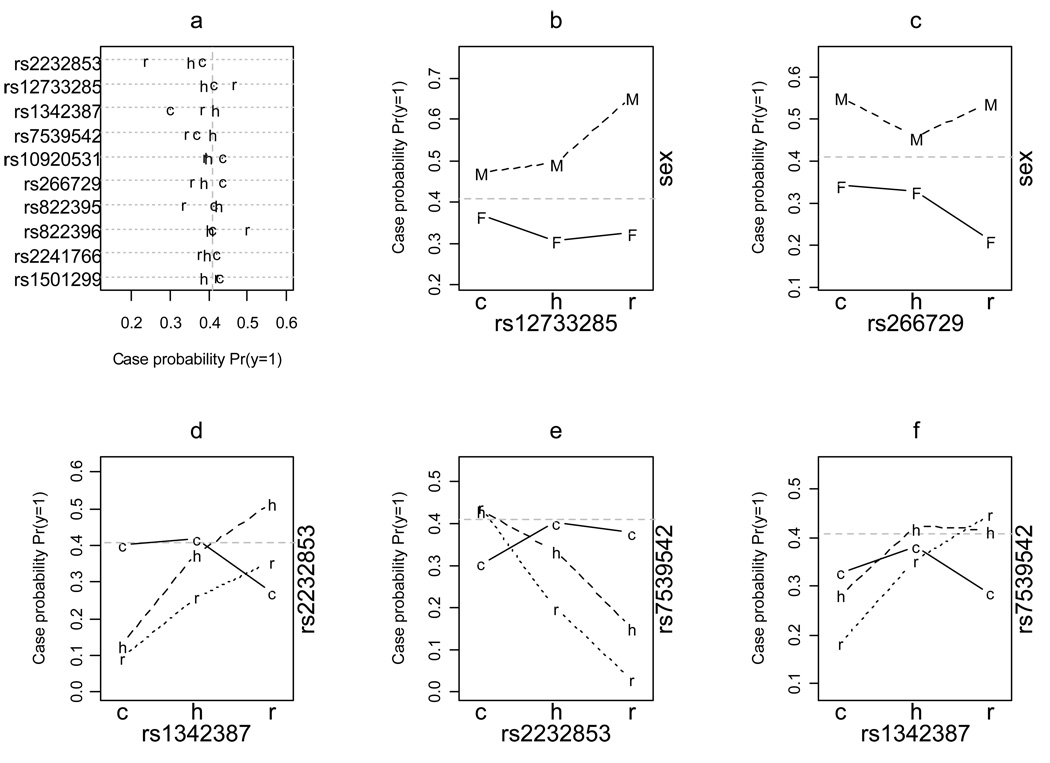
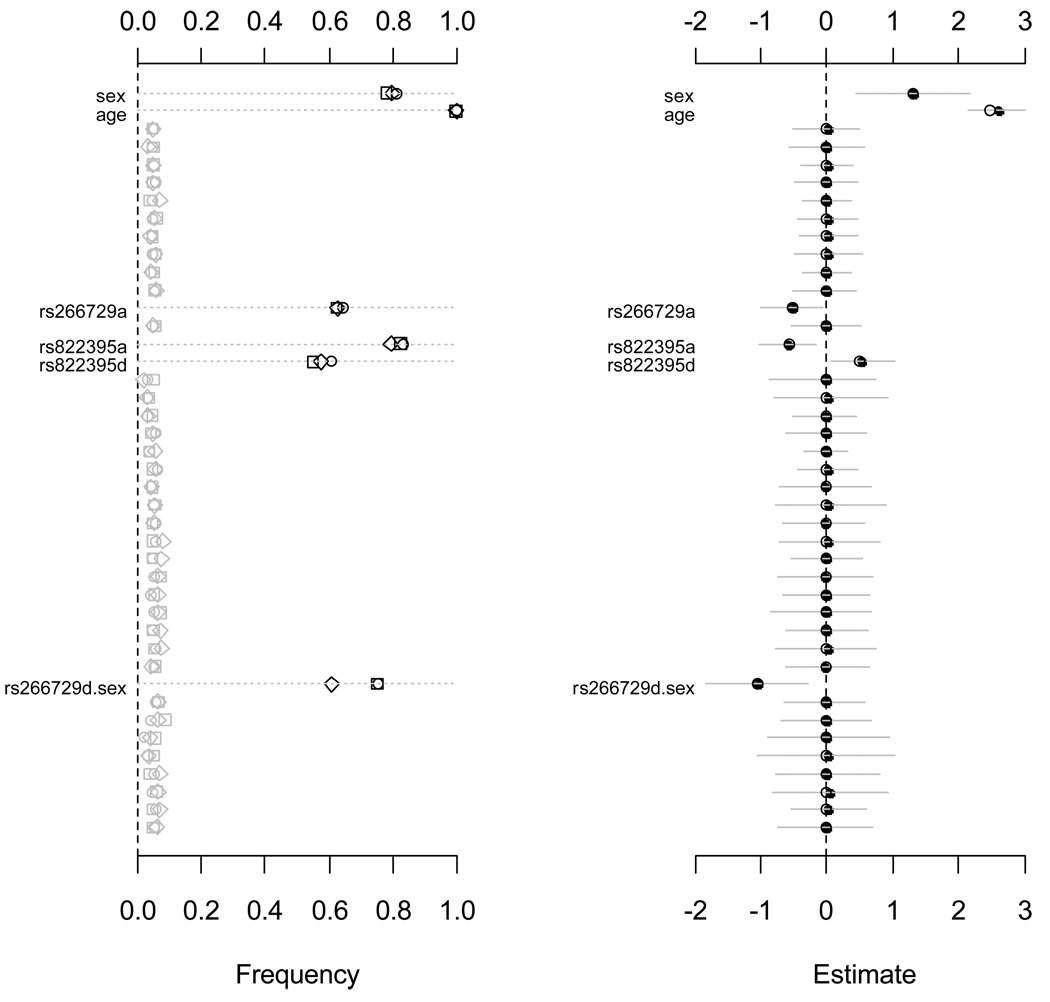
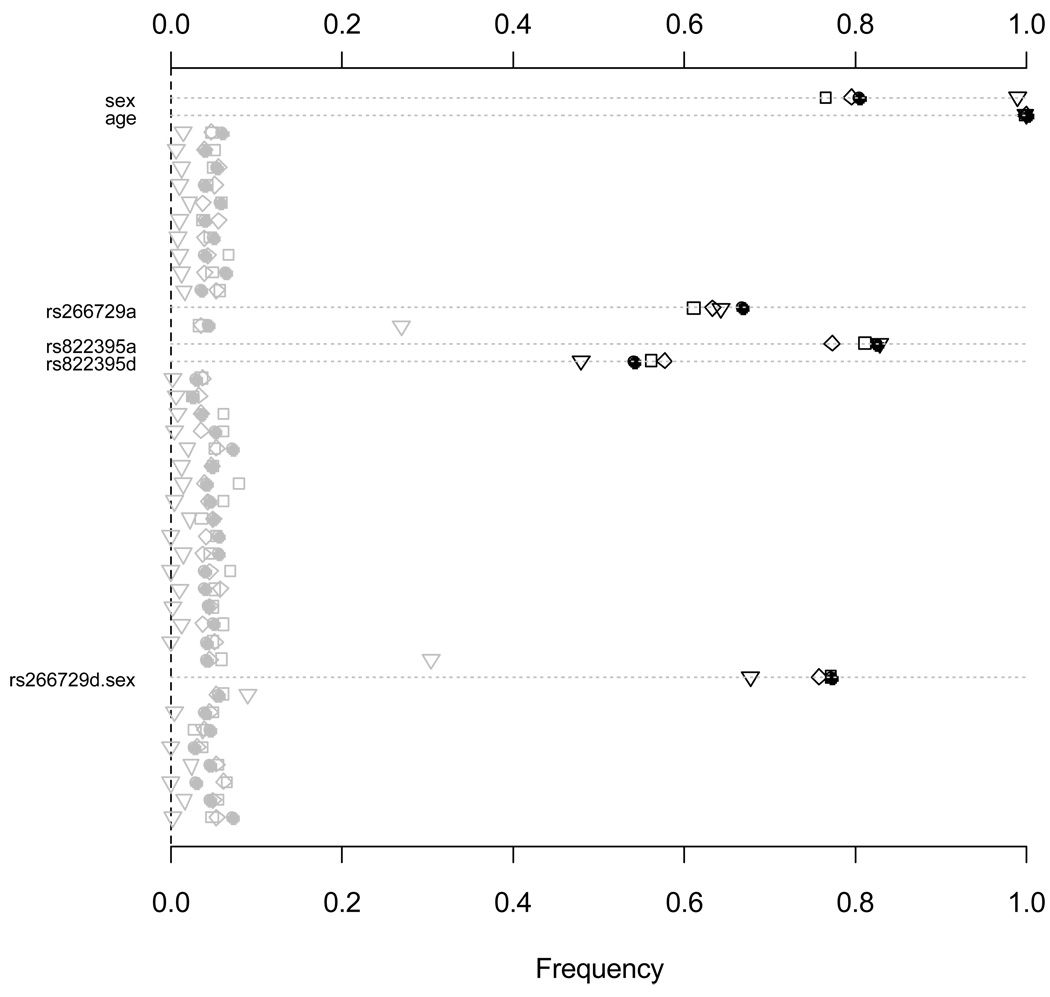
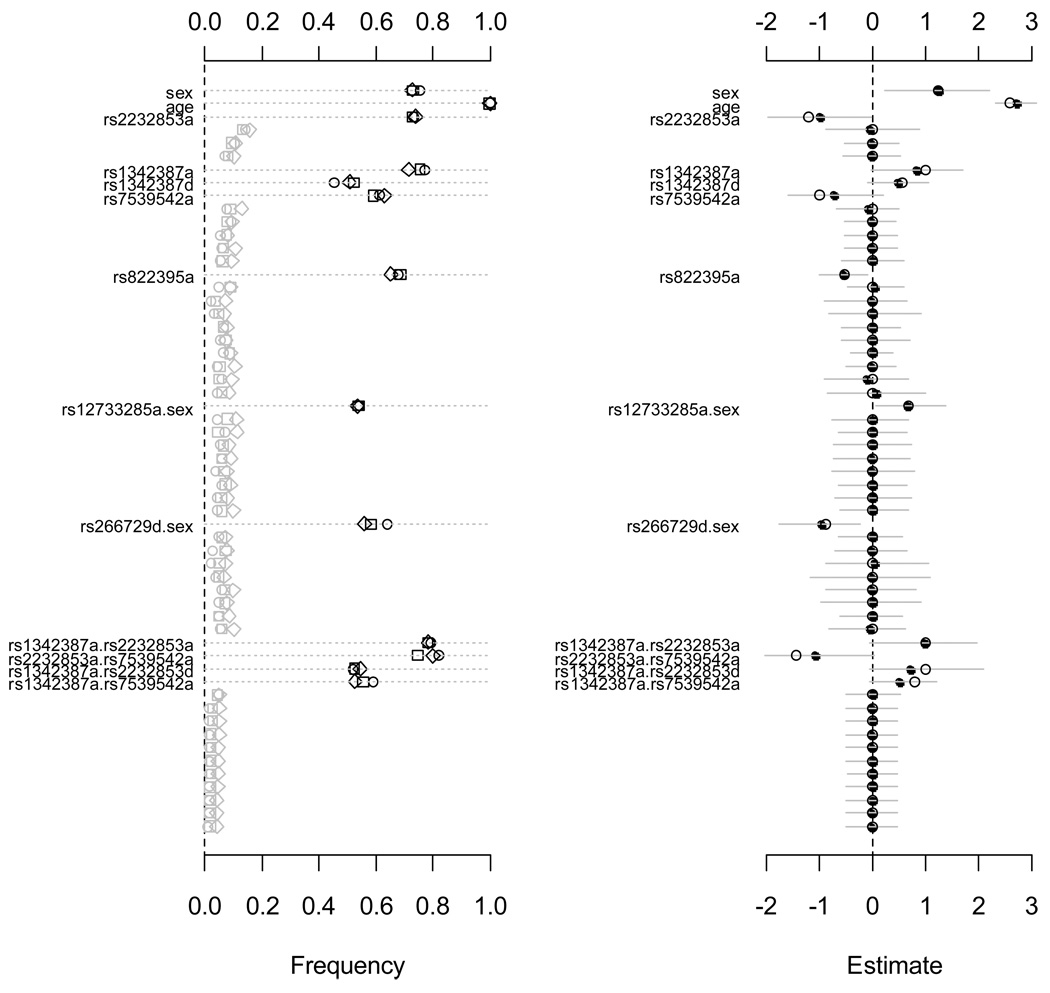
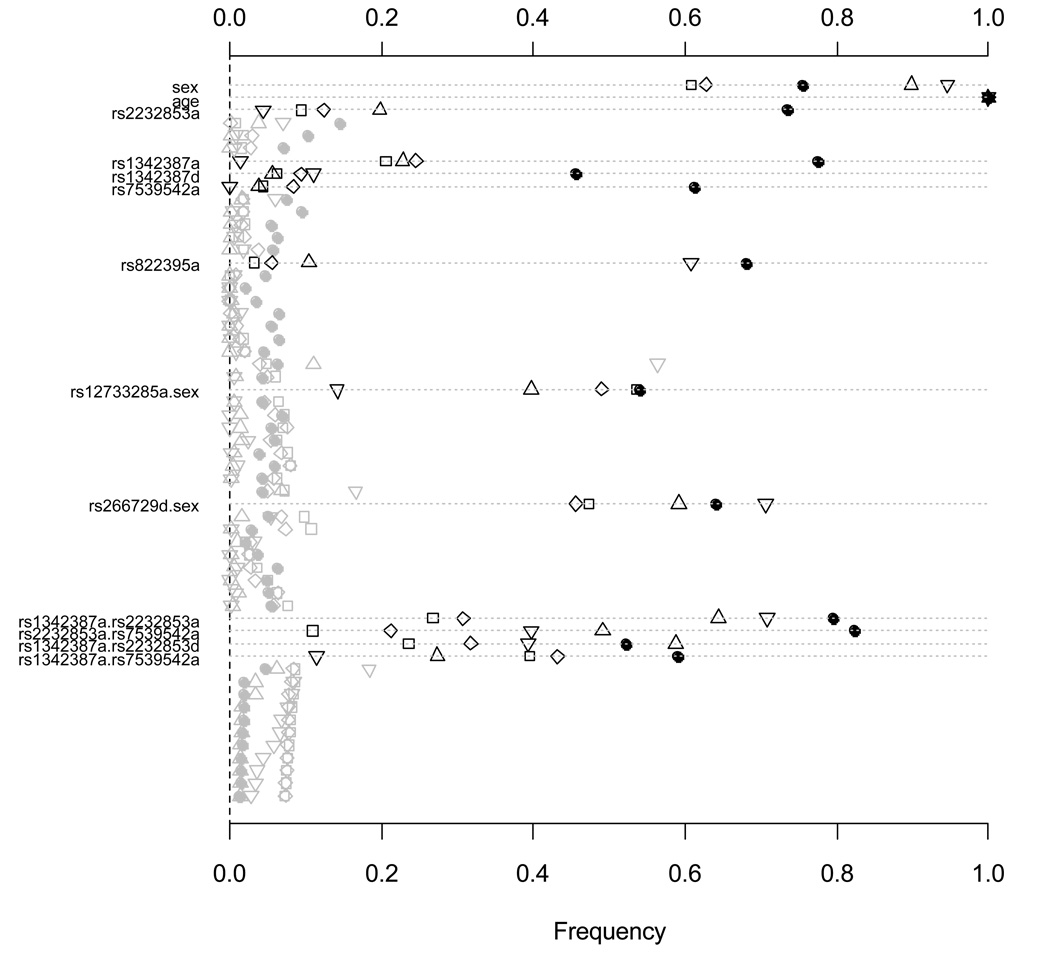
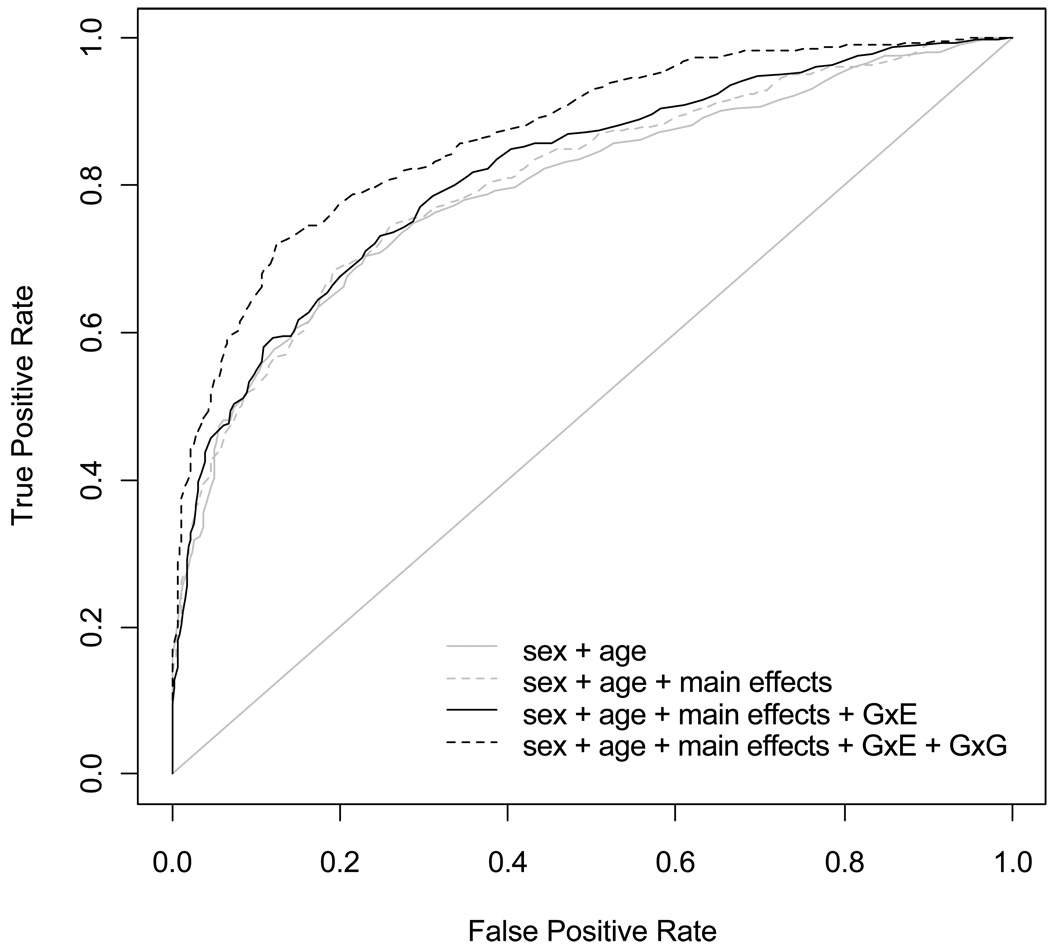
Complex diseases such as cancers are influenced by interacting networks of genetic and environmental factors. However, a joint analysis of multiple genes and environmental factors is challenging, owing to potentially large numbers of correlated and complex variables. We describe Bayesian generalized linear models for simultaneously analyzing covariates, main effects of numerous loci, gene-gene and gene-environment interactions in population case-control studies. Our Bayesian models use Student-t prior distributions with different shrinkage parameters for different types of effects, allowing reliable estimates of main effects and interactions and hence increasing the power for detection of real signals. We implement a fast and stable algorithm for fitting models by extending available tools for classical generalized linear models to the Bayesian case. We propose a novel method to interpret and visualize models with multiple interactions by computing the average predictive probability. Simulations show that the method has the potential to dissect interacting networks of complex diseases. Application of the method to a large case-control study of adiponectin genes and colorectal cancer risk highlights the previous results and detects new epistatic interactions and sex-specific effects that warrant follow-up in independent studies.
© 2010 The Authors Annals of Human Genetics © 2010 Blackwell Publishing Ltd/University College London.
Figures
Similar articles
-
Multiple comparisons in genetic association studies: a hierarchical modeling approach.Stat Appl Genet Mol Biol. 2014 Feb;13(1):35-48. doi: 10.1515/sagmb-2012-0040. Stat Appl Genet Mol Biol. 2014. PMID: 24259248 Free PMC article.
-
An efficient Bayesian model selection approach for interacting quantitative trait loci models with many effects.Genetics. 2007 Jul;176(3):1865-77. doi: 10.1534/genetics.107.071365. Epub 2007 May 4. Genetics. 2007. PMID: 17483424 Free PMC article.
-
Bayesian mixture modeling of gene-environment and gene-gene interactions.Genet Epidemiol. 2010 Jan;34(1):16-25. doi: 10.1002/gepi.20429. Genet Epidemiol. 2010. PMID: 19492346 Free PMC article.
-
Complex system approaches to genetic analysis Bayesian approaches.Adv Genet. 2010;72:47-71. doi: 10.1016/B978-0-12-380862-2.00003-5. Adv Genet. 2010. PMID: 21029848 Free PMC article. Review.
-
Application of Bayesian genomic prediction methods to genome-wide association analyses.Genet Sel Evol. 2022 May 13;54(1):31. doi: 10.1186/s12711-022-00724-8. Genet Sel Evol. 2022. PMID: 35562659 Free PMC article. Review.
Cited by
-
A Bayesian approach to identify genes and gene-level SNP aggregates in a genetic analysis of cancer data.Stat Interface. 2015;8(2):137-151. doi: 10.4310/SII.2015.v8.n2.a2. Stat Interface. 2015. PMID: 28989562 Free PMC article.
-
Polymorphisms of ADIPOQ and ADIPOR1 and prostate cancer risk.Metabolism. 2011 Sep;60(9):1234-43. doi: 10.1016/j.metabol.2011.01.005. Epub 2011 Mar 12. Metabolism. 2011. PMID: 21397927 Free PMC article.
-
Evaluating methods for modeling epistasis networks with application to head and neck cancer.Cancer Inform. 2015 Feb 10;14(Suppl 2):17-23. doi: 10.4137/CIN.S17289. eCollection 2015. Cancer Inform. 2015. PMID: 25733798 Free PMC article.
-
Hierarchical generalized linear models for multiple groups of rare and common variants: jointly estimating group and individual-variant effects.PLoS Genet. 2011 Dec;7(12):e1002382. doi: 10.1371/journal.pgen.1002382. Epub 2011 Dec 1. PLoS Genet. 2011. PMID: 22144906 Free PMC article.
-
A population-specific correlation between ADIPOQ rs2241766 and rs 1501299 and colorectal cancer risk: a meta-analysis for debate.Int J Clin Oncol. 2017 Apr;22(2):307-315. doi: 10.1007/s10147-016-1044-3. Epub 2016 Oct 4. Int J Clin Oncol. 2017. PMID: 27704292
References
-
- Bao K, Mallick BK. Gene selection using a two-level hierarchical Bayesian model. Bioinformatics. 2004;20:3423–3430. - PubMed
-
- Berrington de Gonza´ lez A, Cox D. Interpretation of interaction: A review. Ann Appl Stat. 2007;1:371–385.
-
- Cordell HJ. Epistasis: what it means, what it doesn't mean, and statistical methods to detect it in humans. Hum Mol Genet. 2002;11(20):2463–2468. - PubMed
Publication types
MeSH terms
Substances
Grants and funding
LinkOut - more resources
Full Text Sources
Medical
Miscellaneous
