

Predictive performances of lipid accumulation product vs. adiposity measures for cardiovascular diseases and all-cause mortality, 8.6-year follow-up: Tehran lipid and glucose study
- PMID: 20846382
- PMCID: PMC2949857
- DOI: 10.1186/1476-511X-9-100
Predictive performances of lipid accumulation product vs. adiposity measures for cardiovascular diseases and all-cause mortality, 8.6-year follow-up: Tehran lipid and glucose study
Abstract
Background: The body mass index (BMI) is the most commonly used marker for evaluating obesity related risks, however, central obesity measures have been proposed to be more informative. Lipid accumulation product (LAP) is an alternative continuous index of lipid accumulation. We sought in this study to assess if LAP can outperform BMI, waist-to-height-ratio (WHtR), or waist-to-hip-ratio (WHpR) in predicting incident cardiovascular disease (CVD) or all-cause mortality.
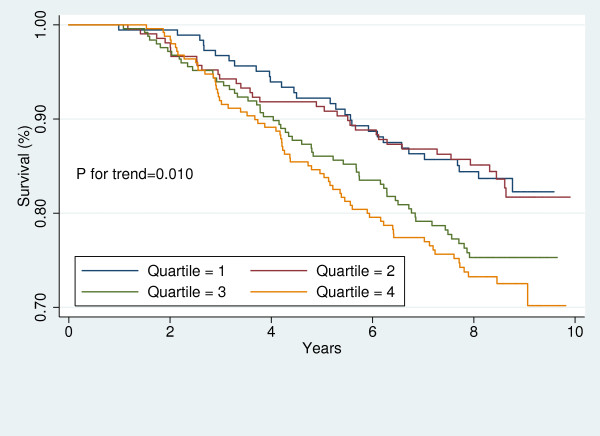
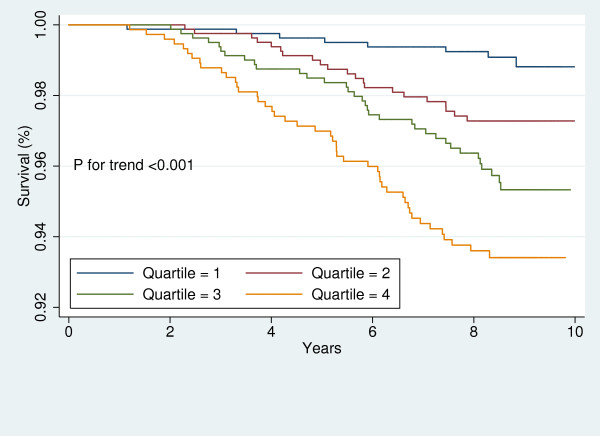
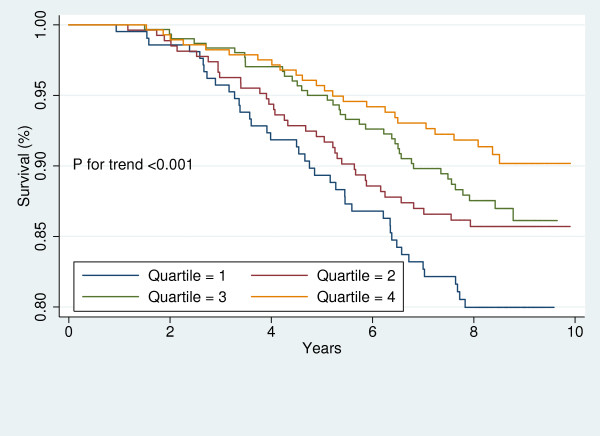
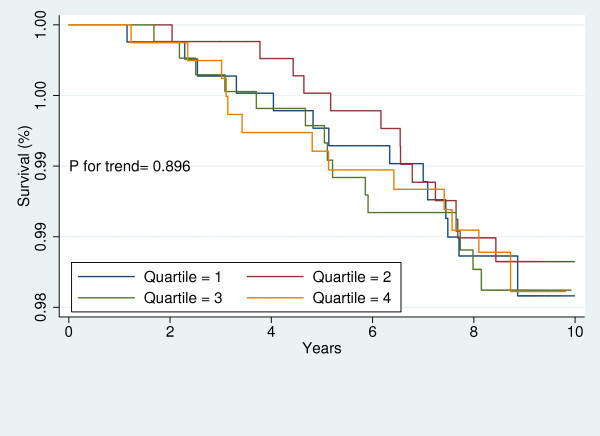
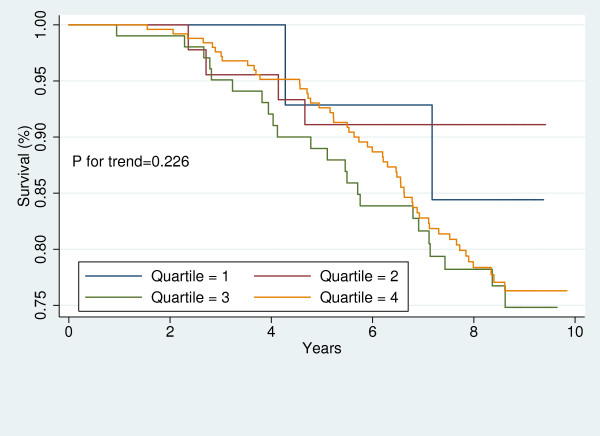
Results: Among participants of Tehran Lipid and Glucose Study, 6,751 participants (2,964 men), aged ≥ 30 years, were followed for a median of 8.6 years. We observed 274 deaths (men: 168) and 447 CVD events (men: 257). Levels of common CVD risk factors significantly increased across LAP quartiles. Mortality rates did not differ by LAP quartiles. Among participants free of CVD at baseline [6331 (2,741 men)], CVD incident rates per 1000 person increased in a stepwise fashion with increasing LAP quartile values in both men (from 6.9 to 17.0) and women (from 1.3 to 13.0), (Ps < 0.001). Among women, a 1-SD increment in log-LAP conferred a 41% increased risk for CVD (HR 1.41, 95% CIs 1.02-1.96). Among men, however, LAP was not observed to be independently associated with increased risk of CVD; except in a sub-group of men assigned to the lifestyle modification interventions, where, LAP predicted CVD risk. After adjustment with CVD risk factors LAP turned to be inversely associated with risk of all-cause mortality (HR, men 0.74, 95% CIs 0.61-0.90; women, 0.94 95% CIs 0.74-1.20). Among women, magnitude of increased risk of CVD due to LAP was not different from those of anthropometric measures. Among men, however, WHpR was observed to be more strongly associated with increased risk of CVD than was LAP. Among neither men nor women were the predictive performances (discrimination, calibration, goodness-of-fit) of the LAP better than those of different anthropometric measures were.
Conclusions: If LAP is to be used for predicting CVD, it might not be superior to WHtR or WHpR.
Figures


Similar articles
-
Diabetes prediction, lipid accumulation product, and adiposity measures; 6-year follow-up: Tehran lipid and glucose study.Lipids Health Dis. 2010 May 10;9:45. doi: 10.1186/1476-511X-9-45. Lipids Health Dis. 2010. PMID: 20459710 Free PMC article.
-
Prognostic significance of the complex "Visceral Adiposity Index" vs. simple anthropometric measures: Tehran lipid and glucose study.Cardiovasc Diabetol. 2012 Mar 7;11:20. doi: 10.1186/1475-2840-11-20. Cardiovasc Diabetol. 2012. PMID: 22394430 Free PMC article.
-
CVD-predictive performances of "a body shape index" versus simple anthropometric measures: Tehran lipid and glucose study.Eur J Nutr. 2016 Feb;55(1):147-57. doi: 10.1007/s00394-015-0833-1. Epub 2015 Jan 18. Eur J Nutr. 2016. PMID: 25596850
-
Association of lipid accumulation product with type 2 diabetes mellitus, hypertension, and mortality: a systematic review and meta-analysis.J Diabetes Metab Disord. 2022 Aug 30;21(2):1943-1973. doi: 10.1007/s40200-022-01114-z. eCollection 2022 Dec. J Diabetes Metab Disord. 2022. PMID: 36404835 Free PMC article. Review.
-
Diabetes Mellitus: Findings from 20 Years of the Tehran Lipid and Glucose Study.Int J Endocrinol Metab. 2018 Oct 16;16(4 Suppl):e84784. doi: 10.5812/ijem.84784. eCollection 2018 Oct. Int J Endocrinol Metab. 2018. PMID: 30584445 Free PMC article. Review.
Cited by
-
Metabolic Obesity in People with Normal Body Weight (MONW)-Review of Diagnostic Criteria.Int J Environ Res Public Health. 2022 Jan 6;19(2):624. doi: 10.3390/ijerph19020624. Int J Environ Res Public Health. 2022. PMID: 35055447 Free PMC article. Review.
-
The Association between Cardio-metabolic and hepatic indices and anthropometric measures with metabolically obesity phenotypes: a cross-sectional study from the Hoveyzeh Cohort Study.BMC Endocr Disord. 2023 May 29;23(1):122. doi: 10.1186/s12902-023-01372-9. BMC Endocr Disord. 2023. PMID: 37246210 Free PMC article.
-
Chinese visceral adiposity index outperforms other obesity indexes in association with increased overall cancer incidence: findings from prospective MJ cohort study.Br J Cancer. 2025 Aug;133(2):227-238. doi: 10.1038/s41416-025-03041-1. Epub 2025 May 10. Br J Cancer. 2025. PMID: 40346173 Free PMC article.
-
Effect of lipid accumulation product on the development of hypertension among nondiabetic individuals in eastern China: A cross-sectional study.J Clin Hypertens (Greenwich). 2023 Aug;25(8):784-793. doi: 10.1111/jch.14696. Epub 2023 Jul 11. J Clin Hypertens (Greenwich). 2023. PMID: 37433158 Free PMC article.
-
Lipid accumulation product and visceral adiposity index for incidence of cardiovascular diseases and mortality; results from 13 years follow-up in Isfahan cohort study.Obes Sci Pract. 2023 Oct 2;10(1):e713. doi: 10.1002/osp4.713. eCollection 2024 Feb. Obes Sci Pract. 2023. PMID: 38264005 Free PMC article.
References
-
- Fontbonne A, Charles MA, Thibult N, Richard JL, Claude JR, Warnet JM, Rosselin GE, Eschwège E. Hyperinsulinaemia as a predictor of coronary heart disease mortality in a healthy population: the Paris Prospective Study, 15-year follow-up. Diabetologia. 1991;34:356–361. doi: 10.1007/BF00405009. - DOI - PubMed
Publication types
MeSH terms
LinkOut - more resources
Full Text Sources
Research Materials
