. 2010 Nov;3(6):743-52.
doi: 10.1161/CIRCIMAGING.108.835793. Epub 2010 Sep 16.

Late gadolinium-enhancement cardiac magnetic resonance identifies postinfarction myocardial fibrosis and the border zone at the near cellular level in ex vivo rat heart

Affiliations

Late gadolinium-enhancement cardiac magnetic resonance identifies postinfarction myocardial fibrosis and the border zone at the near cellular level in ex vivo rat heart

Erik B Schelbert et al. Circ Cardiovasc Imaging. 2010 Nov.

Abstract

Background: using a resolution 1000-fold higher than prior studies, we studied (1) the degree to which late gadolinium-enhancement (LGE) cardiac magnetic resonance tracks fibrosis from chronic myocardial infarction and (2) the relationship between intermediate signal intensity and partial volume averaging at distinct "smooth" infarct borders versus disorganized mixtures of fibrosis and viable cardiomyocytes.

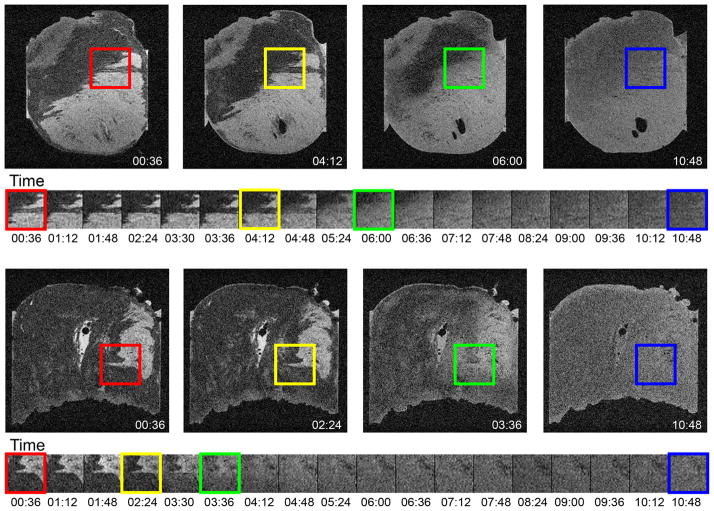
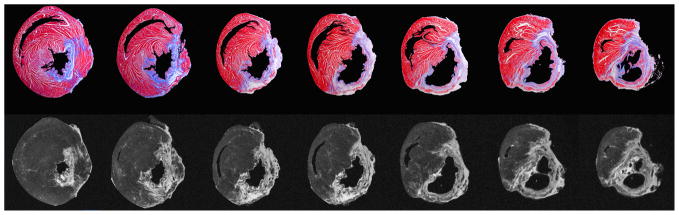
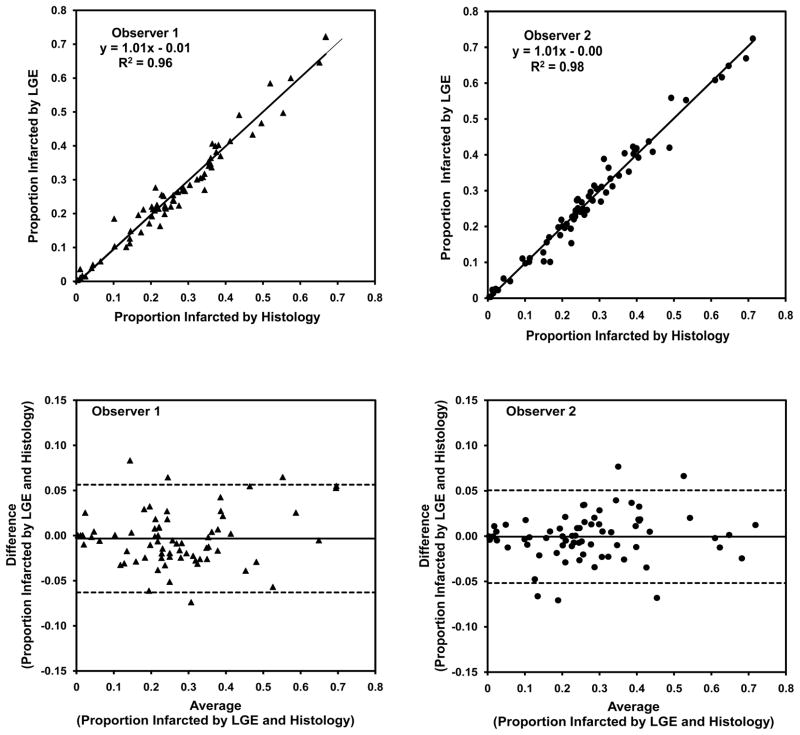
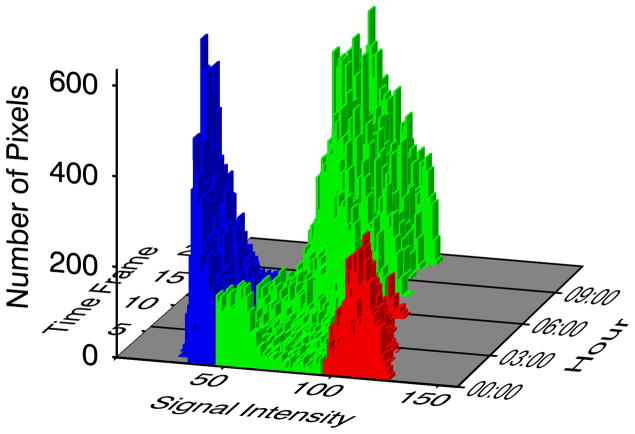
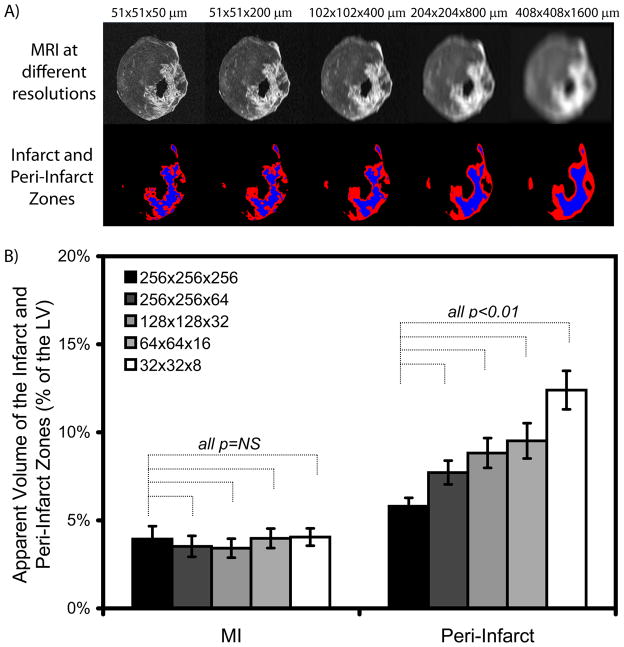
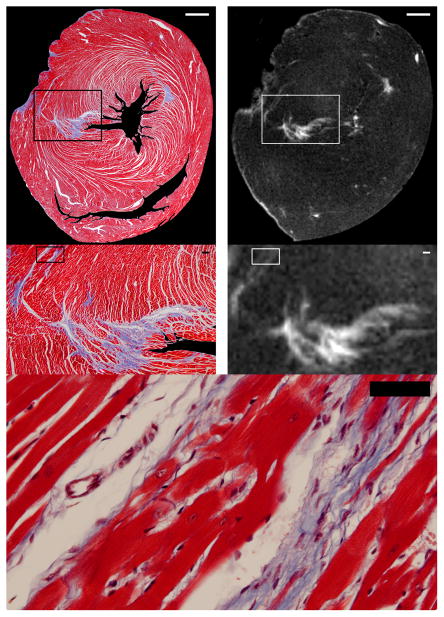
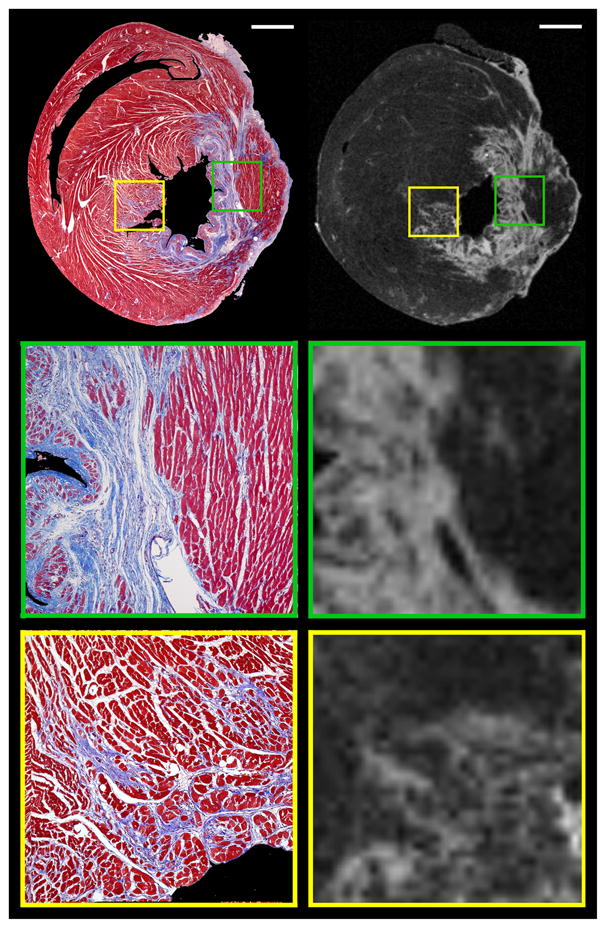
Methods and results: sprague-Dawley rats underwent myocardial infarction by coronary ligation. Two months later, rats were euthanized 10 minutes after administration of 0.3 mmol/kg intravenous gadolinium. LGE images ex vivo at 7 T with a 3D gradient echo sequence with 50×50×50 μm voxels were compared with histological sections (Masson trichrome). Planimetered histological and LGE regions of fibrosis correlated well (y=1.01x-0.01; R(2)=0.96; P<0.001). In addition, LGE images routinely detected clefts of viable cardiomyocytes 2 to 4 cells thick that separated bands of fibrous tissue. Although LGE clearly detected disorganized mixtures of fibrosis and viable cardiomyocytes characterized by intermediate signal intensity voxels, the percentage of apparent intermediate signal intensity myocardium increased significantly (P<0.01) when image resolution was degraded to resemble clinical resolution consistent with significant partial volume averaging.

Conclusions: these data provide important validation of LGE at nearly the cellular level for detection of fibrosis after myocardial infarction. Although LGE can detect heterogeneous patches of fibrosis and viable cardiomyocytes as patches of intermediate signal intensity, the percentage of intermediate signal intensity voxels is resolution dependent. Thus, at clinical resolutions, distinguishing the peri-infarct border zone from partial volume averaging with LGE is challenging.


Figures

Figure 1
Figure 1
Serial images across time delineate the time course whereby the gadolinium based contrast agent disperses through the tissue. The in vivo distribution of the contrast was captured by sacrificing the animals 10 minutes after intravenous injection of Gd-DTPA. A single slice from the full 3D volume is displayed for two rat hearts. The full field of view is shown at 4 selected time points and a small region of interest centered on a detail at the edge of the infarct is shown at all time points in the experiment. The first several images showed consistent appearance of fine details at the edges of infarcts (red box and subsequent frames). Between the frames 00:36 and 04:12, the edges begin to noticeably blur (yellow box). Subsequent frames show moderate blurring (green box). By the end of the experiment (blue box), the dispersion of contrast lost most of the original distinction of enhanced and non-enhanced tissue. Thus, there was a period of at least 144 minutes for high resolution imaging of the hearts ex vivo.
Figure 2
Figure 2
Histograms of voxel signal intensities (SI) plotted as a function of time (18 serial acquisitions 36 minutes apart). Voxel intensities <50 SI units represent viable myocardium (blue); bright voxels >100 SI units (red) represent acutely infarcted myocardium; and voxels with intermediate signal intensities (50–10 SI) are shown in green. As gadolinium redistributes over time (hours), there is a large increase in the number of intermediate pixels and fewer pixels appear bright enough to classify as infarct or dark enough to classify as normal myocardium.
Figure 3
Figure 3
Comparison of histology and late gadolinium enhancement of chronic myocardial infarction from the base of the heart (left) to the apex (right). The top row shows histologic sections stained with Masson trichrome with collagen-containing areas of fibrosis appearing as blue, and the lower row shows the corresponding late gadolinium enhancement (LGE) images with fibrotic areas appearing bright. On the histologic images, the ventricular cavities and background have been digitally masked to facilitate image comparison.
Figure 4
Figure 4
Correlation and Bland-Altman analysis of infarct size by histology versus late gadolinium enhancement on 69 pairs images by two blinded observers.
Figure 5
Figure 5
High magnification comparisons of histologic and late gadolinium enhancement (LGE) images showing gadolinium contrast tracking fibrosis at nearly the cellular level with high fidelity. Low resolution images are shown on the top row (scale bar=1000 μm). The area enclosed by the boxes in the low resolution images are shown at higher magnification in the middle row (scale bar=100 μm); agreement at nearly the cellular level between histology and LGE is excellent. The highest magnification view at the bottom (scale bar=100 μm) allows one to count the number of cardiomyocytes between bands of fibrosis detected in the boxes superimposed on the images in the middle row. On the histologic images, the ventricular cavities and background have been digitally masked to facilitate image comparison.
Figure 6
Figure 6
Histologic and high resolution late gadolinium enhancement images identify both the heterogeneous peri-infarct border zone, where mixtures of viable cardiomyocytes and collections of fibrosis are intermingled (yellow inset boxes in the top row, magnified in the bottom row), as well as the distinct edge of the infarct, where the infarct and myocardium are separate (green inset boxes in the top row, magnified in the middle row). (Scale bar=500 μm; inset magnification=5.5X; on the histologic images, the ventricular cavities and background have been digitally masked to facilitate image comparison).
Figure 7
Figure 7
The apparent size of peri-infarct border zone depends on image resolution. (A) Progressively reducing image resolution by increasing the voxel size from 51 × 51 × 50 μm to 408 × 408 × 1600 μm (top row, from left to right), brings the number of pixels across the left ventricular wall down to what can be obtained clinically. While the percentage of infarcted myocardium (colored blue on the lower row) did not change significantly as image resolution was degraded (from left to right), the apparent size of the intermediate signal intensity peri-infarct border zone (colored red, lower row) increased significantly as a function of resolution (partial volume effect). (B) This phenomenon is quantified for all rats in the bar graph. The bar and error bars represent the mean +/− 1 standard error.

References

    1. Karamitsos TD, Francis JM, Myerson S, Selvanayagam JB, Neubauer S. The role of cardiovascular magnetic resonance imaging in heart failure. J Am Coll Cardiol. 2009;54:1407–1424. - PubMed
    1. Choi KM, Kim RJ, Gubernikoff G, Vargas JD, Parker M, Judd RM. Transmural extent of acute myocardial infarction predicts long-term improvement in contractile function. Circulation. 2001;104:1101–1107. - PubMed
    1. Kim RJ, Wu E, Rafael A, Chen EL, Parker MA, Simonetti O, Klocke FJ, Bonow RO, Judd RM. The use of contrast-enhanced magnetic resonance imaging to identify reversible myocardial dysfunction. N Engl J Med. 2000;343:1445–1453. - PubMed
    1. Kim RJ, Shah DJ. Fundamental concepts in myocardial viability assessment revisited: when knowing how much is "alive" is not enough. Heart. 2004;90:137–140. - PMC - PubMed
    1. Schvartzman PR, Srichai MB, Grimm RA, Obuchowski NA, Hammer DF, McCarthy PM, Kasper JM, White RD. Nonstress delayed-enhancement magnetic resonance imaging of the myocardium predicts improvement of function after revascularization for chronic ischemic heart disease with left ventricular dysfunction. Am Heart J. 2003;146:535–541. - PubMed

Publication types