. 2010 Sep 17;329(5998):1534-7.
doi: 10.1126/science.1191701.

Differential arginylation of actin isoforms is regulated by coding sequence-dependent degradation

Affiliations

Differential arginylation of actin isoforms is regulated by coding sequence-dependent degradation

Fangliang Zhang et al. Science. .

Abstract

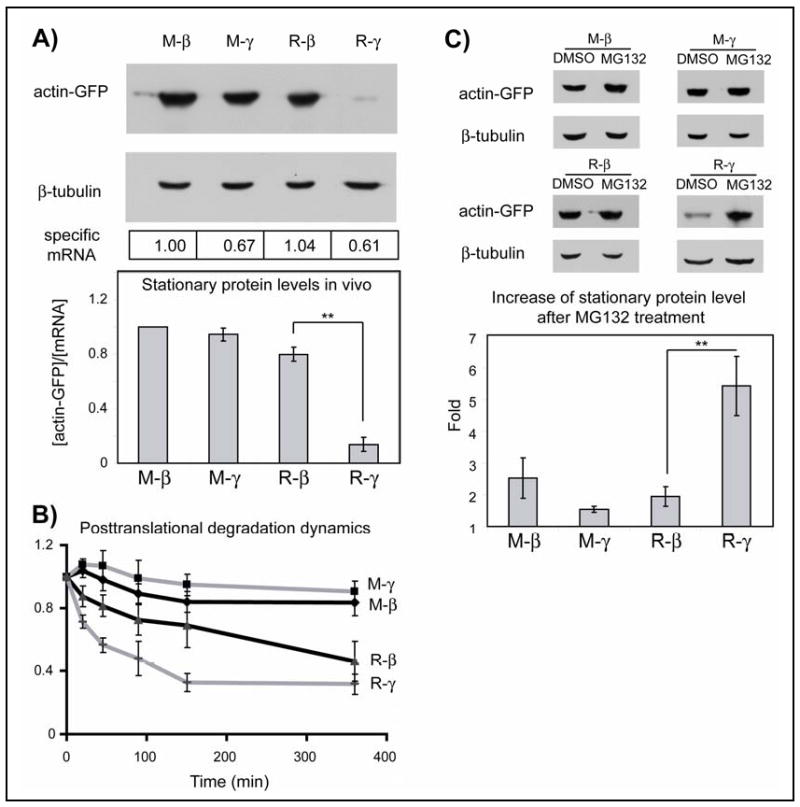
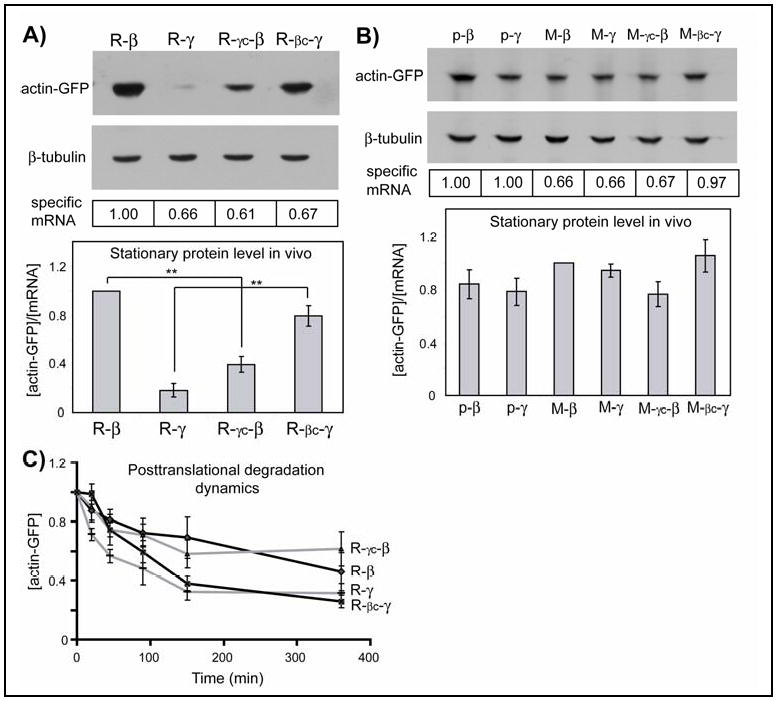
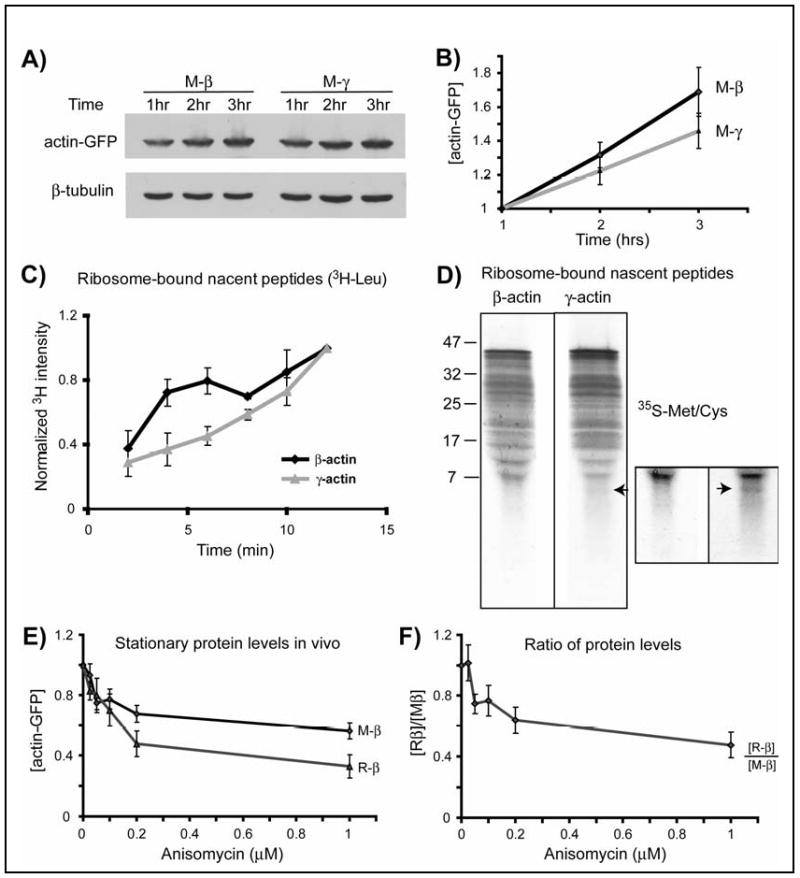
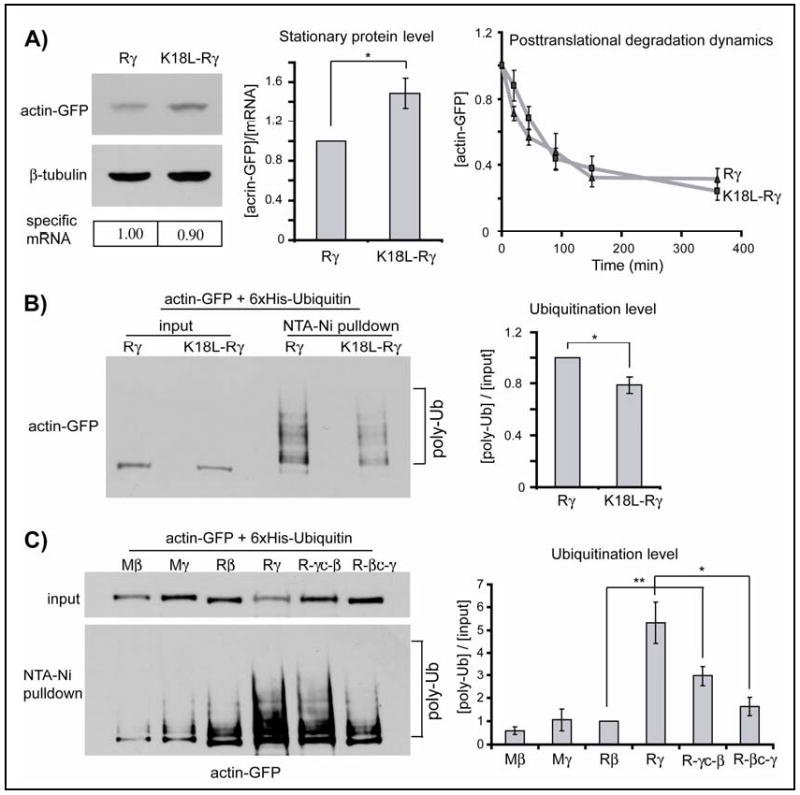
The mammalian cytoskeletal proteins β- and γ-actin are highly homologous, but only β-actin is amino-terminally arginylated in vivo, which regulates its function. We examined the metabolic fate of exogenously expressed arginylated and nonarginylated actin isoforms. Arginylated γ-actin, unlike β-, was highly unstable and was selectively ubiquitinated and degraded in vivo. This instability was regulated by the differences in the nucleotide coding sequence between the two actin isoforms, which conferred different translation rates. γ-actin was translated more slowly than β-actin, and this slower processing resulted in the exposure of a normally hidden lysine residue for ubiquitination, leading to the preferential degradation of γ-actin upon arginylation. This degradation mechanism, coupled to nucleotide coding sequence, may regulate protein arginylation in vivo.


Figures

Figure 1
Figure 1. Arginylated γ-actin is selectively degraded
A. Top: Representative immunoblots of the lysates of HEK 293T cells transfected with actin-GFP constructs probed with anti-GFP and β-tubulin as a loading control. Boxed numbers at the bottom indicate the specific mRNA levels in each sample. Bottom: Quantifications of the stationary protein levels as the amounts of in vivo actin-GFP per mRNA unit, normalized to the level of M-β-actin (n= 4 for R-β, R-γ and 6 for M-β, M-γ). B. Changes in actin protein level over time in the presence of cycloheximide, normalized to zero time point (n= 3 for M-β, M-γ and 6 for R-β, R-γ). C. Top: representative immunoblots showing the stationary protein levels of the actin fusions and β-tubulin loading control in cells treated with DMSO or MG132. Bottom, quantification of the fold change of each fusion protein upon MG132 treatment compared to the DMSO-treated sample (n= 3 for M-β, M-γ, R-β and 6 for R-γ). Numbers in all panels represent mean +/-SEM; ** P<0.01, Student's t-test.
Figure 2
Figure 2. Coding sequence affects stationary protein levels of arginylated actin isoforms without affecting their posttranslational degradation dynamics
A, B. Representative immunoblots of the lysates of HEK 293T cells transfected with actin-GFP constructs probed with anti-GFP and β-tubulin as a loading control. Boxed numbers at the bottom indicate corresponding mRNA levels. Histogram: stationary protein levels of each actin species quantified per mRNA unit and normalized to the level of R-β- (A) or M-β-actin (B). In A, n=5; in B, n=3 for p-β and p-γ-, the constructs that contain no N-terminal Ub fusion (Fig. S2, SOM Text 2), M- γc-β, and M- βc-γ and 6 for M- β, M-γ. C. Changes in actin protein levels over time in the presence of cycloheximide, normalized to the protein level at zero time point (n= 5 for R- γc-β, R-βc- γ- and 6 for R-β, R- γ). Numbers in all panels represent mean +/- SEM; ** P<0.01, Student's t-test.
Figure 3
Figure 3. Slower translation of γ-actin is linked to arginylation-mediated degradation
A. Representative immunoblots of the lysates of HEK 293T cells transfected with actin-GFP constructs and treated with MG132, probed with anti-GFP and β-tubulin as a loading control. B. Quantification of protein levels for M-β and M-γ-actin adjusted to the starting mRNA level and normalized to the 1 hr time point in each set (n=8). C. Incorporation of 3H-Leu into ribosome-bound nascent peptides of β- and γ-actin over time, normalized to 12′ time point (n=3). D. Pattern of 35S-labeled nascent peptides. Boxed area represents the bottom part of the same gel, contrasted to emphasize the lower molecular weight bands using Adobe Photoshop ‘brightness/contrast’ function applied equally to the entire inset image. Arrow in both images indicates the additional low molecular weight band present in γ-actin. Similar results were observed in two independent repeats. E. Stationary protein levels of actin proteins plotted against the increasing concentrations of anisomycin. F. Stationary levels of actin proteins from the experiment shown in E, quantified by independently performed Western blots by loading M-β and R-β side by side and plotted as ratio of [R-β]/[M-β] against anisomycin concentration. Curves in E and F are normalized to the sample with 0 μM of anisomycin in each set (n=3). Numbers in all panels represent mean +/- SEM.
Figure 4
Figure 4. Co-translational degradation of arginylated γ-actin is achieved via a ubiquitin-dependent mechanism
A. Left: Representative immunoblots of the lysates of HEK 293T cells transfected with actin-GFP constructs probed with anti-GFP and β-tubulin as a loading control; specific mRNA levels are indicated below each lane. Middle: stationary protein levels generated with each construct quantified per mRNA unit and normalized to the level of arginylated γ-actin (n=4). Right: changes in actin protein levels over time in the presence of cycloheximide, normalized to the protein level at zero time point (n= 4 for K18L-Rγ and 6 for R-γ). B. Left: Total actin-GFP levels in cells co-transfected with actin constructs and His-tagged ubiquitin (input), and in the pellet after His-tag pulldown to enrich for ubiquitinated proteins (pulldown). Right: quantification of the ubiquitination levels (n=3). Levels of K18L- R-γ mutant are normalized to those of R-γ. C. Left: representative immunoblots of the input and His-tag-Ub pulldown for the constructs marked on the top. Right: quantification of the ubiquitination levels, normalized to those of R-β (n=3). Numbers in all panels represent mean +/- SEM; * P<0.05, ** P<0.01, Student's t-test.

Comment in

References

    1. Otey CA, Kalnoski MH, Lessard JL, Bulinski JC. J Cell Biol. 1986 May;102:1726. - PMC - PubMed
    1. Otey CA, Kalnoski MH, Bulinski JC. J Cell Biochem. 1987 Jun;34:113. - PubMed
    1. Hofer D, Ness W, Drenckhahn D. J Cell Sci. 1997 Mar;110(Pt 6):765. - PubMed
    1. Condeelis J, Singer RH. Biol Cell. 2005 Jan;97:97. - PubMed
    1. Rubenstein PA, Martin DJ. J Biol Chem. 1983 Mar 25;258:3961. - PubMed

Publication types

MeSH terms