

Feeding frequency and appetite in lean and obese prepubertal children
- PMID: 20847731
- PMCID: PMC5111550
- DOI: 10.1038/oby.2010.205
Feeding frequency and appetite in lean and obese prepubertal children
Abstract
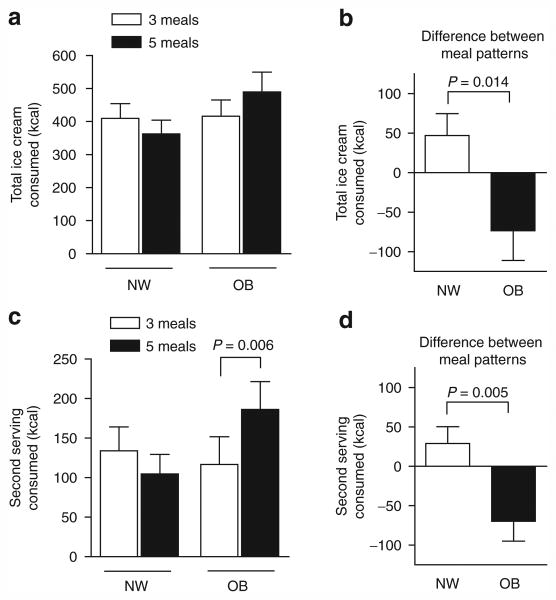
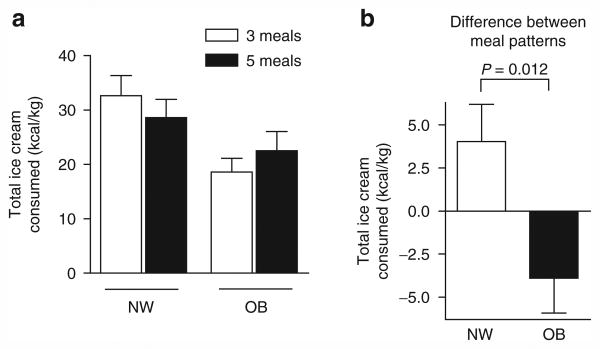
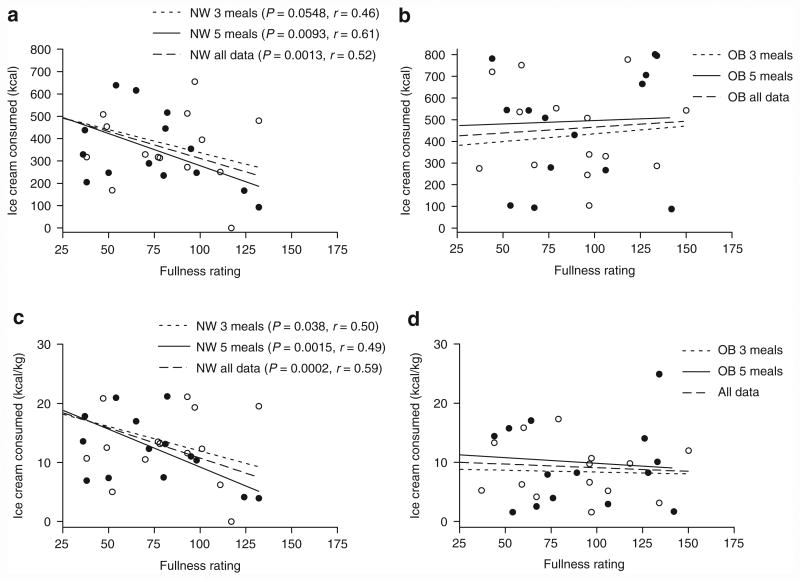
To determine the effect of feeding frequency on appetite in normal weight (NW) and obese (OB) prepubertal children, we carried out a prospective, randomized interventional study of 18 NW and 17 OB children ages 6-10. Children received three or five feedings in random order on separate days. Total calories, carbohydrate, protein, and fat composition on each day were equal. Two hours following the last feeding, children were offered ice cream ad lib. The major outcome variable was kilocalories ice cream consumed. A visual analog scale to assess fullness was also administered before consumption of ice cream. We observed that OB children consumed 73.0 ± 37.4 kcal more after five feedings than after three feedings whereas the NW children consumed 47.1 ± 27.8 kcal less. There was significant interaction between meal pattern and weight group indicating that this change in ice cream consumption differed significantly between groups (P = 0.014 by two-factor analysis). Ice cream intake/kg was less in OB compared to NW subjects (P = 0.012). Fullness ratings before ice cream did not differ by meal pattern or weight group. However, pre-ice cream fullness predicted ice cream intake in NW but not OB children. In summary, OB and NW children differed in appetite response to meal frequency. Our data suggest that: (i) satiety in OB children is related more to proximity of calories (larger supper) than to antecedent distribution of calories and; (ii) NW children may be more prone to restrict intake based on subjective fullness.
Conflict of interest statement
The authors declared no conflict of interest.
Figures
Similar articles
-
Caloric compensation and appetite control in children of different weight status and predisposition to obesity.Appetite. 2020 Aug 1;151:104701. doi: 10.1016/j.appet.2020.104701. Epub 2020 Apr 11. Appetite. 2020. PMID: 32289325 Free PMC article.
-
A comparison of short-term appetite and energy intakes in normal weight and obese boys following glucose and whey-protein drinks.Int J Obes (Lond). 2008 Feb;32(2):362-71. doi: 10.1038/sj.ijo.0803709. Epub 2007 Aug 14. Int J Obes (Lond). 2008. PMID: 17700578
-
Predictors of Post-Exercise Energy Intake in Adolescents Ranging in Weight Status from Overweight to Severe Obesity.Nutrients. 2022 Jan 5;14(1):223. doi: 10.3390/nu14010223. Nutrients. 2022. PMID: 35011098 Free PMC article.
-
Slower eating speed lowers energy intake in normal-weight but not overweight/obese subjects.J Acad Nutr Diet. 2014 Mar;114(3):393-402. doi: 10.1016/j.jand.2013.11.002. Epub 2013 Dec 30. J Acad Nutr Diet. 2014. PMID: 24388483 Clinical Trial.
-
Effects of meals high in carbohydrate, protein, and fat on ghrelin and peptide YY secretion in prepubertal children.J Clin Endocrinol Metab. 2009 Nov;94(11):4463-71. doi: 10.1210/jc.2009-0949. Epub 2009 Oct 9. J Clin Endocrinol Metab. 2009. PMID: 19820013 Free PMC article.
References
-
- Baskin ML, Ard J, Franklin F, Allison DB. Prevalence of obesity in the United States. Obes Rev. 2005;6:5–7. - PubMed
-
- Ogden CL, Carroll MD, Curtin LR, et al. Prevalence of overweight and obesity in the United States, 1999-2004. JAMA. 2006;295:1549–1555. - PubMed
-
- Clément K. Genetics of human obesity. Proc Nutr Soc. 2005;64:133–142. - PubMed
-
- Strauss R. Childhood obesity. Curr Probl Pediatr. 1999;29:1–29. - PubMed
Publication types
MeSH terms
Substances
Grants and funding
LinkOut - more resources
Full Text Sources
Medical
Miscellaneous
