

Waist circumference, BMI, and visceral adipose tissue in white women and women of African descent
- PMID: 20847732
- PMCID: PMC3474331
- DOI: 10.1038/oby.2010.201
Waist circumference, BMI, and visceral adipose tissue in white women and women of African descent
Abstract
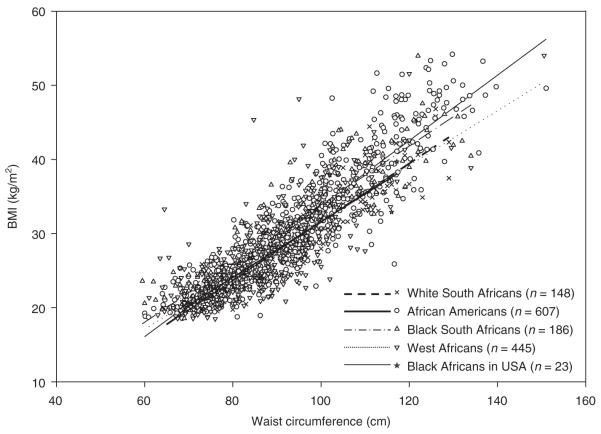
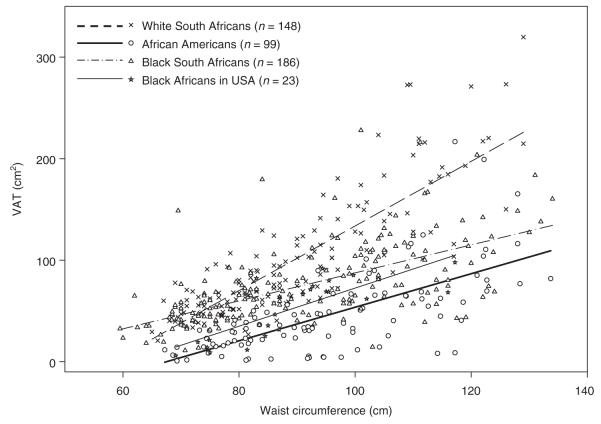
Although waist circumference (WC) is a marker of visceral adipose tissue (VAT), WC cut-points are based on BMI category. We compared WC-BMI and WC-VAT relationships in blacks and whites. Combining data from five studies, BMI and WC were measured in 1,409 premenopausal women (148 white South Africans, 607 African-Americans, 186 black South Africans, 445 West Africans, 23 black Africans living in United States). In three of five studies, participants had VAT measured by computerized tomography (n = 456). Compared to whites, blacks had higher BMI (29.6 ± 7.6 (mean ± s.d.) vs. 27.6 ± 6.6 kg/m², P = 0.001), similar WC (92 ± 16 vs. 90 ± 15 cm, P = 0.27) and lower VAT (64 ± 42 vs. 101 ± 59 cm², P < 0.001). The WC-BMI relationship did not differ by race (blacks: β (s.e.) WC = 0.42 (.01), whites: β (s.e.) WC = 0.40 (0.01), P = 0.73). The WC-VAT relationship was different in blacks and whites (blacks: β (s.e.) WC = 1.38 (0.11), whites: β (s.e.) WC = 3.18 (0.21), P < 0.001). Whites had a greater increase in VAT per unit increase in WC. WC-BMI and WC-VAT relationships did not differ among black populations. As WC-BMI relationship did not differ by race, the same BMI-based WC guidelines may be appropriate for black and white women. However, if WC is defined by VAT, race-specific WC thresholds are required.
Figures
References
-
- Alberti KG, Eckel RH, Grundy SM, et al. Harmonizing the metabolic syndrome: a joint interim statement of the International Diabetes Federation Task Force on Epidemiology and Prevention; National Heart, Lung, and Blood Institute; American Heart Association; World Heart Federation; International Atherosclerosis Society; and International Association for the Study of Obesity Circulation. 2009;120:1640–1645. - PubMed
-
- Micklesfield LK, Evans J, Norris SA, et al. Dual-energy X-ray absorptiometry and anthropometric estimates of visceral fat in Black and White South African Women. Obesity (Silver Spring) 2010;18:619–624. - PubMed
-
- Cowie CC, Rust KF, Byrd-Holt DD, et al. Prevalence of diabetes and impaired fasting glucose in adults in the U.S. population: National Health And Nutrition Examination Survey 1999-2002. Diabetes Care. 2006;29:1263–1268. - PubMed
-
- Lloyd-Jones D, Adams R, Carnethon M, et al. Heart disease and stroke statistics-2009 update: a report from the American Heart Association Statistics Committee and Stroke Statistics Subcommittee. Circulation. 2009;119:e21–181. - PubMed
Publication types
MeSH terms
Grants and funding
LinkOut - more resources
Full Text Sources
Research Materials
