

Genetic predictors of medically refractory ulcerative colitis
- PMID: 20848476
- PMCID: PMC2959149
- DOI: 10.1002/ibd.21293
Genetic predictors of medically refractory ulcerative colitis
Abstract
Background: Acute severe ulcerative colitis (UC) remains a significant clinical challenge and the ability to predict, at an early stage, those individuals at risk of colectomy for medically refractory UC (MR-UC) would be a major clinical advance. The aim of this study was to use a genome-wide association study (GWAS) in a well-characterized cohort of UC patients to identify genetic variation that contributes to MR-UC.
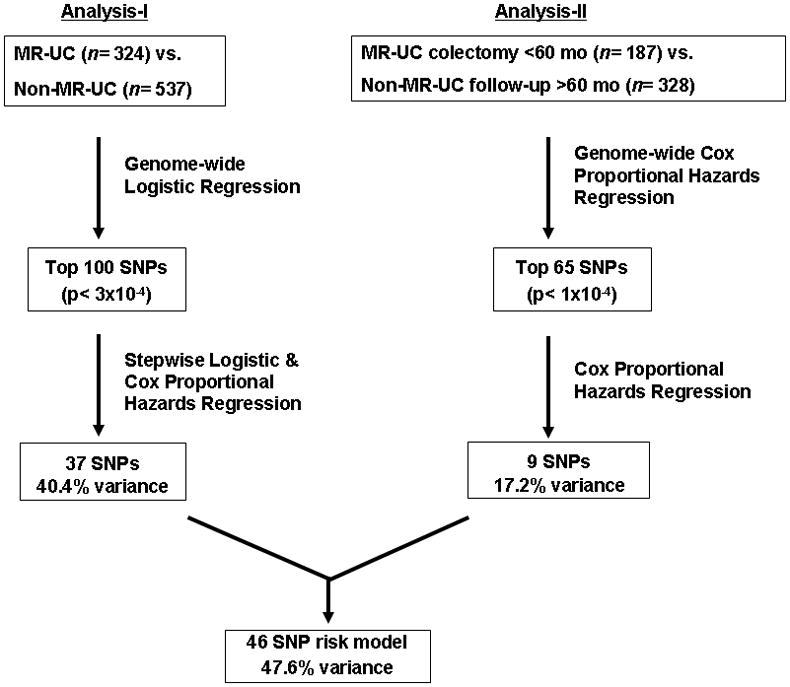
Methods: A GWAS comparing 324 MR-UC patients with 537 non-MR-UC patients was analyzed using logistic regression and Cox proportional hazards methods. In addition, the MR-UC patients were compared with 2601 healthy controls.
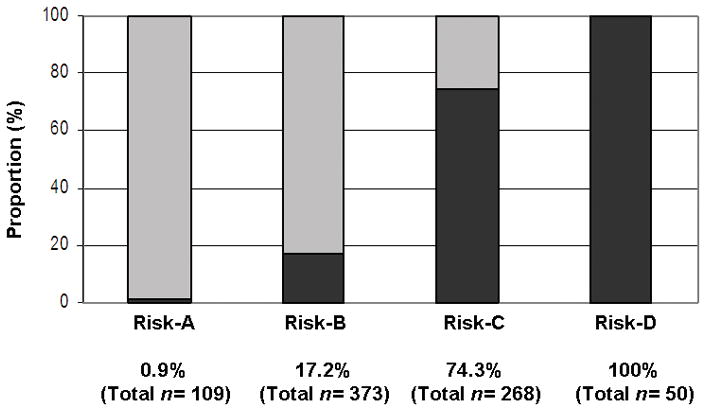
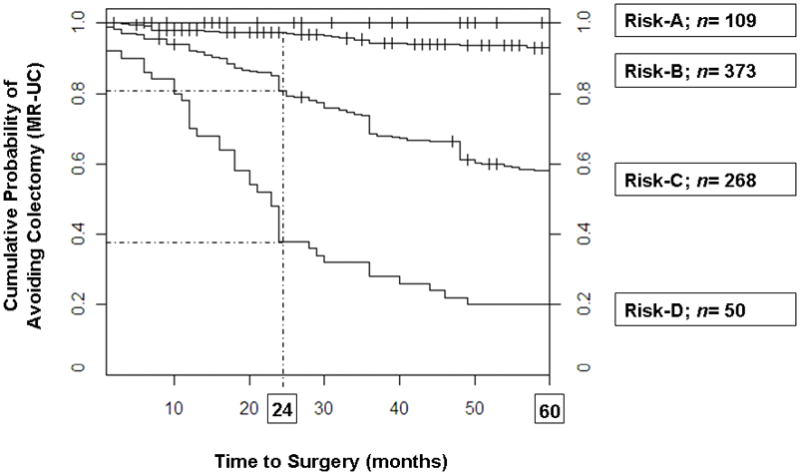
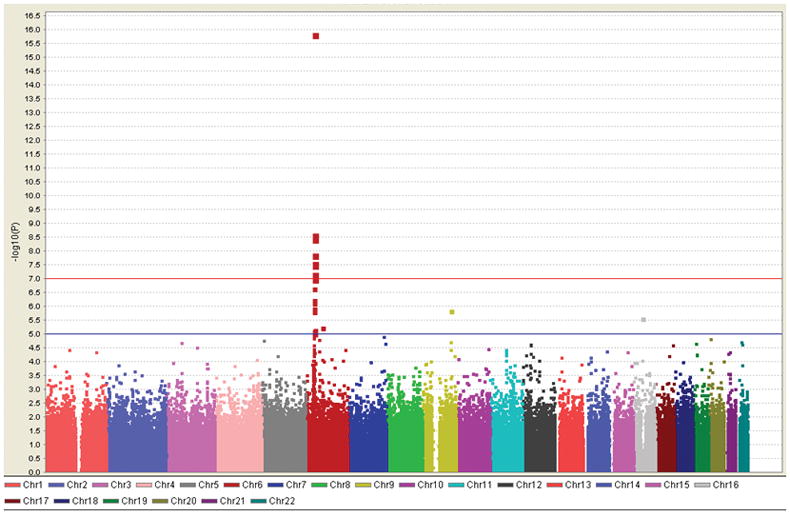
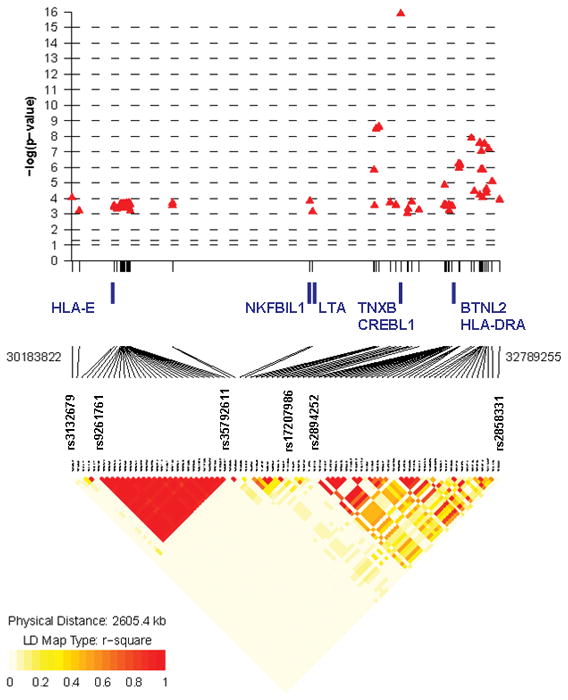
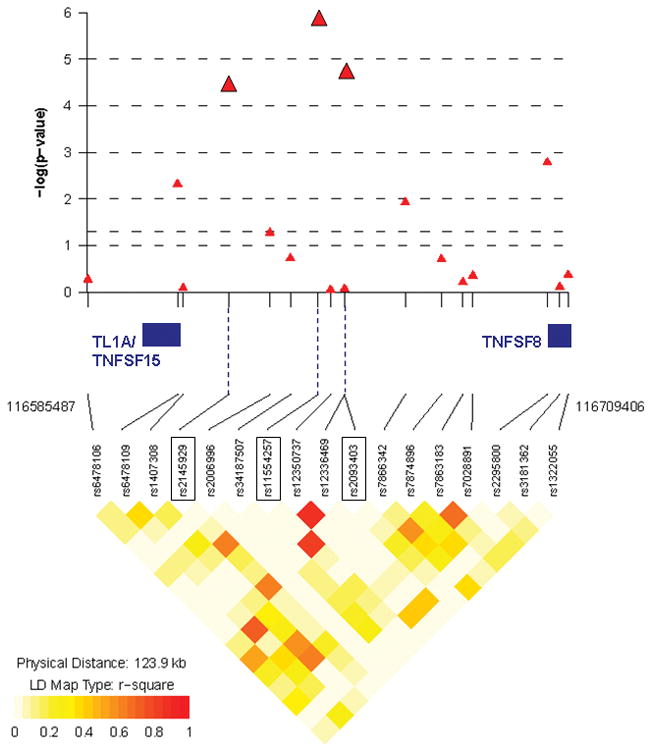
Results: MR-UC was associated with more extensive disease (P = 2.7 × 10(-6)) and a positive family history of UC (P = 0.004). A risk score based on the combination of 46 single nucleotide polymorphisms (SNPs) associated with MR-UC explained 48% of the variance for colectomy risk in our cohort. Risk scores divided into quarters showed the risk of colectomy to be 0%, 17%, 74%, and 100% in the four groups. Comparison of the MR-UC subjects with healthy controls confirmed the contribution of the major histocompatibility complex to severe UC (peak association: rs17207986, P = 1.4 × 10(-16)) and provided genome-wide suggestive association at the TNFSF15 (TL1A) locus (peak association: rs11554257, P = 1.4 × 10(-6)).
Conclusions: A SNP-based risk scoring system, identified here by GWAS analyses, may provide a useful adjunct to clinical parameters for predicting the natural history of UC. Furthermore, discovery of genetic processes underlying disease severity may help to identify pathways for novel therapeutic intervention in severe UC.
Conflict of interest statement
Figures
References
-
- Franke A, Balschun T, Karlsen TH, et al. Replication of signals from recent studies of Crohn’s disease identifies previously unknown disease loci for ulcerative colitis. Nat Genet. 2008;40:713–5. - PubMed
-
- Franke A, Balschun T, Karlsen TH, et al. Sequence variants in IL10, ARPC2 and multiple other loci contribute to ulcerative colitis susceptibility. Nat Genet. 2008;40:1319–23. - PubMed
Publication types
MeSH terms
Substances
Grants and funding
- M01-RR00425/RR/NCRR NIH HHS/United States
- U01 HL080295/HL/NHLBI NIH HHS/United States
- N01 HC075150/HC/NHLBI NIH HHS/United States
- R21 DK084554/DK/NIDDK NIH HHS/United States
- N01 HC085085/HC/NHLBI NIH HHS/United States
- R01 HL087652/HL/NHLBI NIH HHS/United States
- N01-HC-85086/HC/NHLBI NIH HHS/United States
- M01 RR000425/RR/NCRR NIH HHS/United States
- N01 HC085084/HC/NHLBI NIH HHS/United States
- N01-HC-85079/HC/NHLBI NIH HHS/United States
- P01-DK046763/DK/NIDDK NIH HHS/United States
- N01 HC045133/HC/NHLBI NIH HHS/United States
- N01 HC035129/HC/NHLBI NIH HHS/United States
- N01 HC015103/HC/NHLBI NIH HHS/United States
- N01 HC085086/HL/NHLBI NIH HHS/United States
- R01 DK033651/DK/NIDDK NIH HHS/United States
- N01 HC085082/HC/NHLBI NIH HHS/United States
- P30 DK063491/DK/NIDDK NIH HHS/United States
- N01 HC085080/HC/NHLBI NIH HHS/United States
- N01 HC-55222/HC/NHLBI NIH HHS/United States
- N01 HC055222/HL/NHLBI NIH HHS/United States
- N01 HC055222/HC/NHLBI NIH HHS/United States
- N01 HC085079/HL/NHLBI NIH HHS/United States
- N01-HC-75150/HC/NHLBI NIH HHS/United States
- R03 DK076984/DK/NIDDK NIH HHS/United States
- DK063491/DK/NIDDK NIH HHS/United States
- N01 HC085079/HC/NHLBI NIH HHS/United States
- P01 DK046763/DK/NIDDK NIH HHS/United States
- N01 HC075150/HL/NHLBI NIH HHS/United States
- DK084554/DK/NIDDK NIH HHS/United States
- R01 DK056328/DK/NIDDK NIH HHS/United States
- DK76984/DK/NIDDK NIH HHS/United States
LinkOut - more resources
Full Text Sources
Other Literature Sources
Medical