. 2010 Dec;31(12):1326-42.
doi: 10.1002/humu.21360. Epub 2010 Nov 2.

Detection of clinically relevant exonic copy-number changes by array CGH

Affiliations

Detection of clinically relevant exonic copy-number changes by array CGH

Philip M Boone et al. Hum Mutat. 2010 Dec.

Abstract

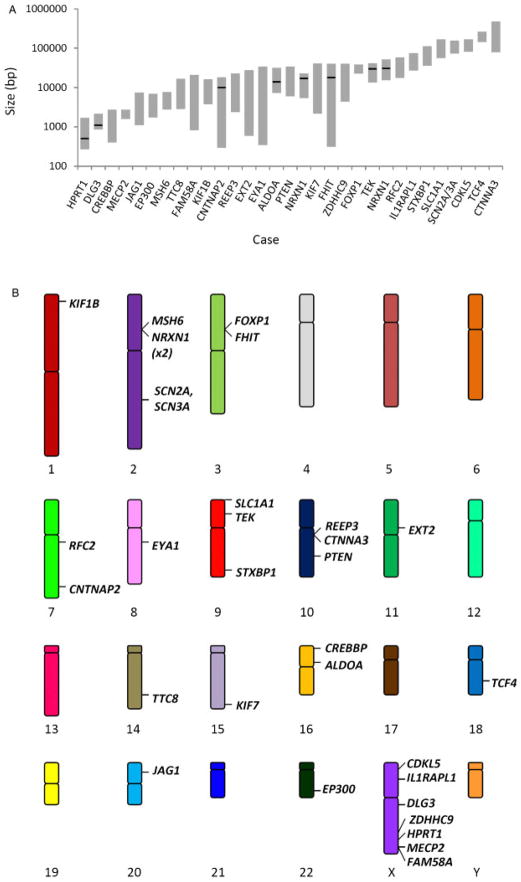
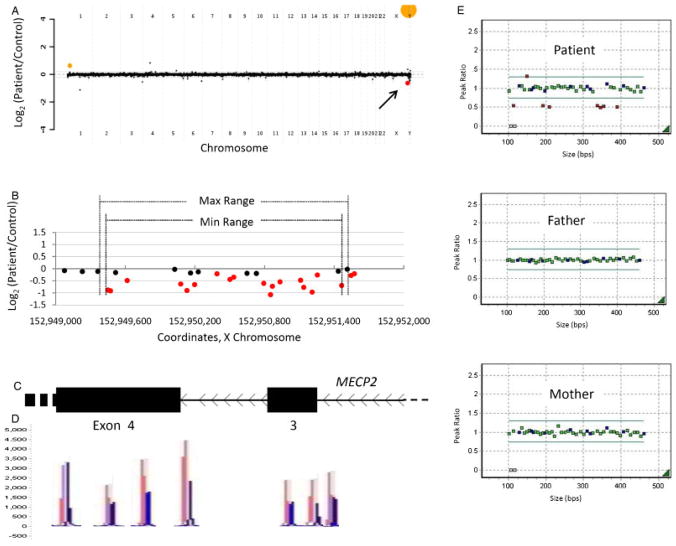
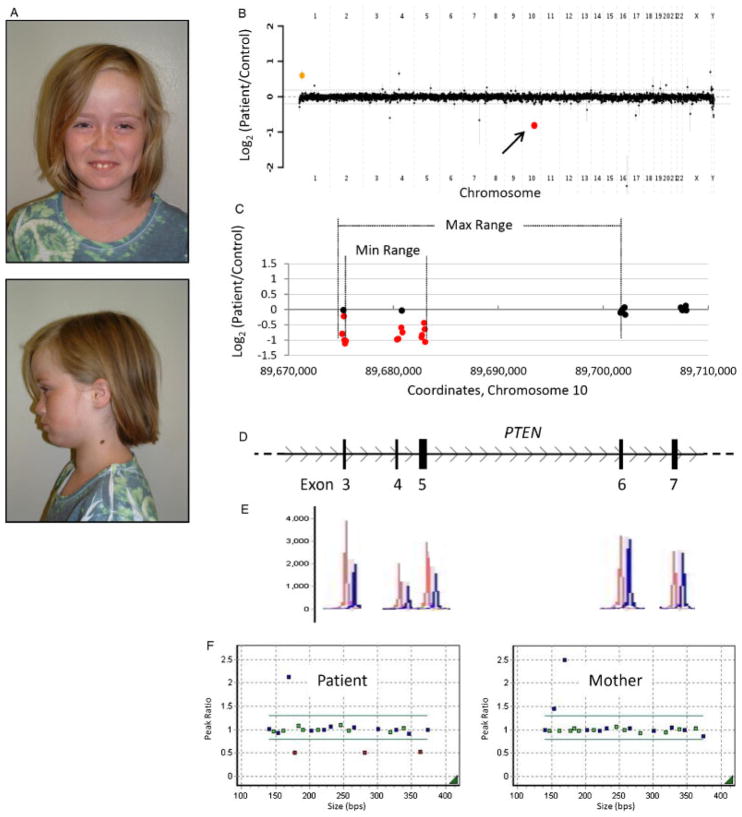
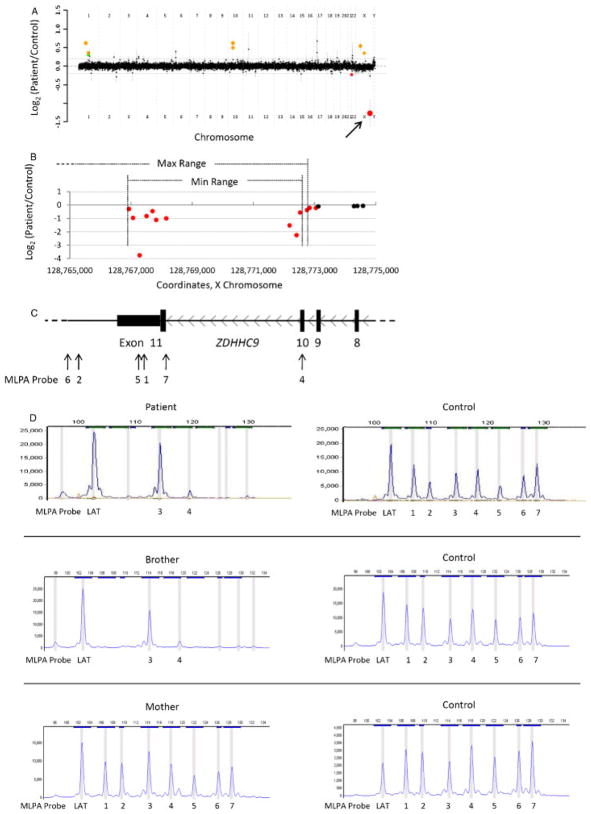
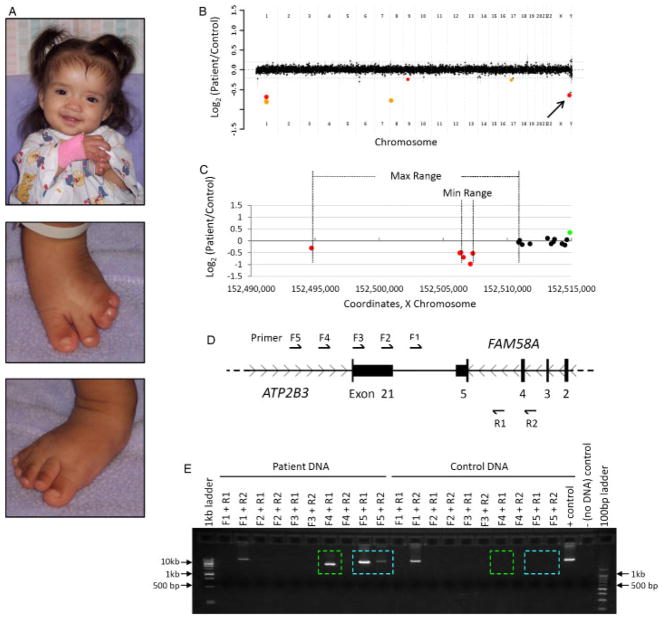
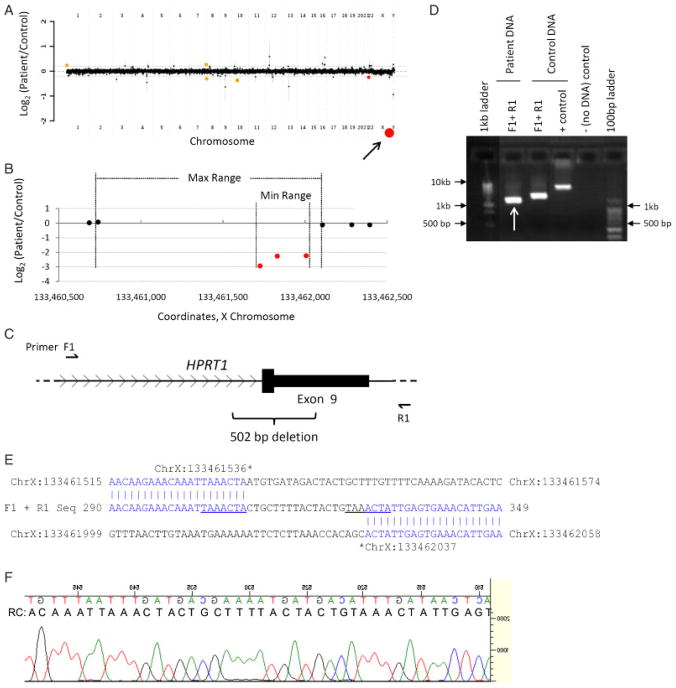
Array comparative genomic hybridization (aCGH) is a powerful tool for the molecular elucidation and diagnosis of disorders resulting from genomic copy-number variation (CNV). However, intragenic deletions or duplications--those including genomic intervals of a size smaller than a gene--have remained beyond the detection limit of most clinical aCGH analyses. Increasing array probe number improves genomic resolution, although higher cost may limit implementation, and enhanced detection of benign CNV can confound clinical interpretation. We designed an array with exonic coverage of selected disease and candidate genes and used it clinically to identify losses or gains throughout the genome involving at least one exon and as small as several hundred base pairs in size. In some patients, the detected copy-number change occurs within a gene known to be causative of the observed clinical phenotype, demonstrating the ability of this array to detect clinically relevant CNVs with subkilobase resolution. In summary, we demonstrate the utility of a custom-designed, exon-targeted oligonucleotide array to detect intragenic copy-number changes in patients with various clinical phenotypes.


Figures

Figure 1
Figure 1
Intragenic CNVs from <103 bp to >105 bp in size have been detected throughout the genome. A: Sizes of intragenic losses and gains. Each position along the abscissa represents a unique case, labeled by the gene containing an intragenic CNV. Gray bars span the size range predicted by aCGH. Cases for which DNA sequencing has been performed are marked by a black line at the exact size of the rearrangement. B: A schematic karyogram demonstrating the genomic location of each described CNV.
Figure 2
Figure 2
Patient 1 with an intragenic deletion in MECP2. A: Genome-wide view of the aCGH data. The red point (arrow) indicates the copy-number loss of interest (MECP2). Orange points indicate known benign copy-number variation (CNV) that serve as a positive control of hybridization. B–C: Local view of the MECP2 intragenic deletion. These graphics are aligned with one another. B: Plot of individual array probes, from which a “Min Range” and “Max Range”—defining the minimum and maximum expected boundaries of the deletion, respectively—can be established. C: Genomic map of this region of MECP2. D: MLPA trace confirming a deletion of exon 3 and indicating that a portion of exon 4 is also deleted. Control traces are in red, patient traces in blue. Each has been aligned to the genomic location it interrogates. E: Dot plots displaying normalized MLPA results for the patient and parents, demonstrating that this is a de novo copy-number loss. Green probes interrogate exons of MECP2, blue probes are controls, and red probes indicate copy change.
Figure 3
Figure 3
Patient 2 with an intragenic deletion in PTEN. A: Photos of patient 2, a 9-year-old female with features of Bannayan-Riley-Ruvalcaba syndrome. B: Genome-wide view of aCGH data. The red point (arrow) indicates the copy-number loss of interest (PTEN). The orange point indicates known benign copy-number variation (CNV). C–D: Local view of the PTEN intragenic deletion. These graphics are aligned with one another. C: Plot of individual array probes, from which a “Min Range” and “Max Range”—defining the minimum and maximum expected boundaries of the deletion, respectively—can be established. D: Genomic map of this region of PTEN. E: MLPA trace confirming a deletion of exons 3–5. Control traces are in red, patient traces in blue. Each has been aligned to the exon it interrogates. F: Dot plots displaying normalized MLPA results for the patient and mother, demonstrating that this copy-number loss was not maternally inherited. The father declined to be tested. Green probes interrogate exons of PTEN, blue probes are controls, and red probes indicate copy change.
Figure 4
Figure 4
Patient 6 with an intragenic deletion in ZDHHC9. A: Genome-wide view of aCGH data. Red points indicate copy-number loss. The arrow indicates the copy change of interest (ZDHHC9), while the other indicated loss contains no genes. The green point indicates a copy-number gain that contains no genes. Orange points indicate known benign copy-number variation (CNV). B–C: Local view of the ZDHHC9 intragenic deletion. These graphics are aligned with one another. B: Plot of individual array probes, from which a “Min Range” and “Max Range”—defining the minimum and maximum expected boundaries of the deletion, respectively—can be established. C: Local genomic map of ZDHHC9 showing the locations of MLPA probes used to confirm the deletion. D: MLPA traces confirming a deletion of exons 10 and 11 in the patient, his brother, and their mother. Patient traces are on the left; control traces for each are on the right. “LAT” and “3” are control probes; see Supp. Methods for sequences and genomic coordinates of these probes.
Figure 5
Figure 5
Patient 7 with an intragenic deletion in FAM58A. A: Photos of patient 7, a female with features of STAR syndrome, at nine months of age. B: Genome-wide view of aCGH data. Red points indicate copy-number losses. The point indicated by an arrow is the copy change of interest. The other two losses contain no genes. Orange points indicate known benign copy-number variation (CNV). C–D: Local view of the FAM58A deletion. These graphics are aligned with one another. C: Plot of individual array probes, from which a “Min Range” and “Max Range”—defining the minimum and maximum expected boundaries of the deletion, respectively—can be established. The maximum range also encompasses the final exon of ATP2B3. D: Local genomic map of this region of the X chromosome showing the locations of primers used to confirm the deletion. E: Results of PCR confirming the deletion. Colored boxes indicate PCR products amplified from patient DNA but not from control DNA. In addition to exon 5 of FAM58A, part or all of exon 21 of ATP2B3 is also deleted.
Figure 6
Figure 6
Patient 8 with an intragenic deletion in HPRT1. A: Genome-wide view of aCGH data. Red points indicate copy-number loss. Orange points indicate known benign copy-number variation (CNV). Arrow indicates the copy change of interest (HPRT1). The other loss contains no genes. B–C: Local view of the HPRT1 intragenic deletion. These graphics are aligned with one another. B: Plot of individual array probes, from which a “Min Range” and “Max Range”—defining the minimum and maximum expected boundaries of the deletion, respectively—can be established. C: Genomic map of this region of HPRT1 showing the locations of primers used to confirm the deletion and the exact boundaries of and size of the deletion as determined by DNA sequencing. D: Results of PCR confirming the deletion. Arrow indicates the PCR product that was sequenced. E: Sequencing confirms a partial deletion of exon 9 and identifies an 18 base pair insertion. Sequences of the “upstream” and “downstream” genomic regions, as well as the sequenced PCR product, are displayed. Regions of perfect homology are in blue. A seven base-pair sequence that appears twice at the breakpoint region is underlined. F: Sequencing trace of the breakpoint region. As sequencing was performed in reverse orientation to the reference sequence, a reverse complement (RC) sequence is displayed which matches that in E.

References

    1. Allen RC, Zoghbi HY, Moseley AB, Rosenblatt HM, Belmont JW. Methylation of HpaII and HhaI sites near the polymorphic CAG repeat in the human androgen–receptor gene correlates with X chromosome inactivation. Am J Hum Genet. 1992;51:1229–1239. - PMC - PubMed
    1. Bailey JA, Kidd JM, Eichler EE. Human copy number polymorphic genes. Cytogenet Genome Res. 2008;123:234–243. - PMC - PubMed
    1. Barker K, Martinez A, Wang R, Bevan S, Murday V, Shipley J, Houlston R, Harper J. PTEN mutations are uncommon in Proteus syndrome. J Med Genet. 2001;38:480–481. - PMC - PubMed
    1. Bartnik M, Tsai AC-H, Xia Z, Cheung SW, Stankiewicz P. Disruption of the SCN2A and SCN3A genes in a patient with mental retardation, neurobehavioral and psychiatric abnormalities, and a history of infantile seizures. Clin Genet. (in press) - PubMed
    1. Ben-Shachar S, Khajavi M, Withers MA, Shaw CA, van Bokhoven H, Brunner HG, Lupski JR. Dominant versus recessive traits conveyed by allelic mutations—to what extent is nonsense-mediated decay involved? Clin Genet. 2009;75:394–400. - PubMed

Publication types