. 2010 Dec;23(6):781-94.
doi: 10.1111/j.1755-148X.2010.00773.x.

p53 prevents progression of nevi to melanoma predominantly through cell cycle regulation

Affiliations

p53 prevents progression of nevi to melanoma predominantly through cell cycle regulation

Tamara Terzian et al. Pigment Cell Melanoma Res. 2010 Dec.

Abstract

p53 is the central member of a critical tumor suppressor pathway in virtually all tumor types, where it is silenced mainly by missense mutations. In melanoma, p53 predominantly remains wild type, thus its role has been neglected. To study the effect of p53 on melanocyte function and melanomagenesis, we crossed the ‘high-p53’Mdm4+/− mouse to the well-established TP-ras0/+ murine melanoma progression model. After treatment with the carcinogen dimethylbenzanthracene (DMBA), TP-ras0/+ mice on the Mdm4+/− background developed fewer tumors with a delay in the age of onset of melanomas compared to TP-ras0/+ mice. Furthermore, we observed a dramatic decrease in tumor growth, lack of metastasis with increased survival of TP-ras0/+: Mdm4+/− mice. Thus, p53 effectively prevented the conversion of small benign tumors to malignant and metastatic melanoma. p53 activation in cultured primary melanocyte and melanoma cell lines using Nutlin-3, a specific Mdm2 antagonist, supported these findings. Moreover, global gene expression and network analysis of Nutlin-3-treated primary human melanocytes indicated that cell cycle regulation through the p21WAF1/CIP1 signaling network may be the key anti-melanomagenic activity of p53.


Figures

Figure 1
Figure 1
DMBA-treated TP-ras0/+ mouse, an excellent model to study progression from nevus (N) to melanoma (M) to metastasis. (A) On top, a schematic of the DMBA treatment is represented. Below, upper right panel is an hematoxylin and eosin (HE) section (4×) of a nevus (<5 mm2) showing heavy pigmentation. Lower right panel represents HE of a melanoma (>5 mm2) arising from a pre-existing nevus (MN). Nevus portion of MN (10×) shows heavy pigmentation. As the melanoma progresses and becomes more aggressive, pigmentation is reduced (shown in M area). (B) Left panel represents liver (top) and lung (bottom). Right panels represent HE sections of metastatic lesions and surrounding areas of corresponding left panels (20×).
Figure 2
Figure 2
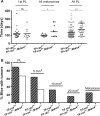
High p53 delays melanoma formation but primarily suppresses the progression of primary to metastatic melanoma. (A) Scatter plot of age of onset of 1st pigmented lesion (PL) (n = 25 for TP-ras0/+ and n = 11 for TP-ras0/+: Mdm4+/− mice), melanomas (n = 14 for TP-ras0/+ and n = 11 for TP-ras0/+: Mdm4+/− mice), and the age of onset of all individual pigmented lesions (n = 113 for TP-ras0/+ and n = 47 for TP-ras0/+: Mdm4+/− mice). The mean is represented by the bar in the center of each plotted data series. ns, not significant (P > 0.05); 1 star, significant (P = 0.01–0.05); 2 stars, very significant (P = 0.001–0.01). (B) Histogram presenting the percentage of mice with pigmented lesions (PL) classified by tumor size and progression. The labels for each of the 5, 10, and 20 mm2 groupings refer to tumors that are ≥ the indicated size.
Figure 3
Figure 3
High p53 prohibited tumor growth. Growth (mm2) of individual tumors of TP-ras0/+ mice (A) and TP-ras0/+: Mdm4+/− mice (B) followed every 10 days from emergence. (C) Box and whisker plot of growth rate (mm2/day) of these tumors based on histological presentation (nevus or melanoma) and size (<5, 5–10 and >10 mm2). The whiskers represent the minimum and maximum growth rates. (D) Kaplan–Meier presentation of the survival of TP-ras0/+ (n = 28) and TP-ras0/+: Mdm4+/− mice (n = 17), Log-rank test P = 0.0441.
Figure 4
Figure 4
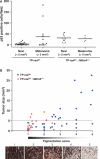
Histological characterization of pigmented lesions. (A) Scatter plot of p53 immunopositive cells in 25 TP-ras0/+ nevi, 12 TP-ras0/+ melanomas, 13 TP-ras0/+: Mdm4+/− nevi, and 4 TP-ras0/+: Mdm4+/− melanomas (>5 mm2) analyzed per field (0.5 mm2 area using 20× magnification). (B) Plot of tumor progression (based on size) in relation to degree of pigmentation of each pigmented lesion using the reference scale from 1 (highest, 100%) to 5 (lowest, 0–10%). A representative picture of hematoxylin and eosin (HE) sections of pigmented lesion scored by the degree of pigmentation (at the bottom).
Figure 5
Figure 5
Effect of Nutlin-3 on human primary melanocytes and melanoma cell lines. (A) Effect of variable concentration of Nutlin-3 on viability of normal human melanocytes (MC) and melanoma cell lines measured by the apoptotic/cell death assay (YO-PRO-1/PI). (B) Histogram presenting proliferation of cells measured by Brdu/PI assay 24 h after 0 (NT) or 10 μM Nutlin-3 treatment.
Figure 6
Figure 6
Effect of Nutlin-3 on clonogenecity of melanoma cell lines. (A) A representative picture (4× magnification) of colony-forming assay of four cell lines (BL: mutant p53, A04 and MM329: wild-type p53). Cell lines treated (NT) or treated with (10, 30 μM) Nutlin-3 were plated on Matrigel matrix and allowed to grow for 72 h before colony counting. All colonies ≥50 cells in the chamber were counted. (B) A graphic representation of the effect of Nutlin-3 treatment on colony counts of tested cell lines.
Figure 7
Figure 7
Effect of Nutlin-3 on pigmentation. (A) A representative picture of increased pigmentation of in A04 cells after treatment with Nutlin-3. (B) Western blot of pigmentation proteins TYR and TYRP1 in primary melanocytes or A04 melanoma cell lines untreated or treated with 10 μM Nutlin-3 for 24 and 72 h. Left panel shows TYR blot. Uppermost band represents glycosylated form of TYR. Right panel shows blot for TYRP1. Actin was used as a loading control.
Figure 8
Figure 8
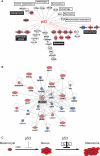
Analysis of p53 target genes in melanocytes treated with Nutlin-3 for 18 h. (A) Representation of p53 target genes based on microarray results. In red, up-regulated genes; in white, genes with no differential expression; in blue, down-regulated genes. (B) Representation of up-regulated (red) and down-regulated (blue) genes in the CDKN1A network generated by Ingenuity pathway analysis tools. Arrows represent the regulatory relationships between genes. (C) Schematic representation of tumor-suppressive activity of p53 in Ras-dependent DMBA-induced progression model from a melanocyte to nevus to metastatic melanoma. GA, growth arrest.

References

    1. Abdel-Malek ZA, Kadekaro AL, Swope VB. Stepping up melanocytes to the challenge of UV exposure. Pigment Cell Melanoma Res. 2010;23:171–186. - PubMed
    1. Albino AP, Vidal MJ, Mcnutt NS, Shea CR, Prieto VG, Nanus DM, Palmer JM, Hayward NK. Mutation and expression of the p53 gene in human malignant melanoma. Melanoma Res. 1994;4:35–45. - PubMed
    1. Bae I, Smith ML, Sheikh MS, Zhan Q, Scudiero DA, Friend SH, O'connor PM, Fornace AJ., Jr An abnormality in the p53 pathway following gamma-irradiation in many wild-type p53 human melanoma lines. Cancer Res. 1996;56:840–847. - PubMed
    1. Bandyopadhyay D, Gatza C, Donehower LA, Medrano EE. Analysis of cellular senescence in culture in vivo: the senescence-associated beta-galactosidase assay. Curr. Protoc. Cell Biol. 2005 Chapter 18, Unit 18.9. - PubMed
    1. Bardeesy N, Bastian BC, Hezel A, Pinkel D, Depinho RA, Chin L. Dual inactivation of RB and p53 pathways in RAS-induced melanomas. Mol. Cell. Biol. 2001;21:2144–2153. - PMC - PubMed

Publication types

MeSH terms