. 2010 Sep 17:11:502.
doi: 10.1186/1471-2164-11-502.

Data-driven assessment of eQTL mapping methods

Affiliations

Data-driven assessment of eQTL mapping methods

Jacob J Michaelson et al. BMC Genomics. .

Abstract

Background: The analysis of expression quantitative trait loci (eQTL) is a potentially powerful way to detect transcriptional regulatory relationships at the genomic scale. However, eQTL data sets often go underexploited because legacy QTL methods are used to map the relationship between the expression trait and genotype. Often these methods are inappropriate for complex traits such as gene expression, particularly in the case of epistasis.

Results: Here we compare legacy QTL mapping methods with several modern multi-locus methods and evaluate their ability to produce eQTL that agree with independent external data in a systematic way. We found that the modern multi-locus methods (Random Forests, sparse partial least squares, lasso, and elastic net) clearly outperformed the legacy QTL methods (Haley-Knott regression and composite interval mapping) in terms of biological relevance of the mapped eQTL. In particular, we found that our new approach, based on Random Forests, showed superior performance among the multi-locus methods.

Conclusions: Benchmarks based on the recapitulation of experimental findings provide valuable insight when selecting the appropriate eQTL mapping method. Our battery of tests suggests that Random Forests map eQTL that are more likely to be validated by independent data, when compared to competing multi-locus and legacy eQTL mapping methods.


Figures

Figure 1
Figure 1
Results of the simulated eQTL models. Results of the simulated eQTL models. Each method-noise level combination where all of the causal loci were contained in the 99th percentile of scores is marked with a '+'. Ranking within the 99th percentile (of the worst-ranking of the causal loci) is indicated by the shade of gray, with lighter shades indicating better ranking.
Figure 2
Figure 2
Percentage of expression traits with a recovered cis-eQTL. For each experimental data set, we calculated the percentage of transcripts which had a marker scoring in the 99th percentile that co-localized with the genomic location of the target gene.
Figure 3
Figure 3
Comparison of eQTL profiles. An example eQTL profile for microarray probe set 1426838_at (Pold3) from the hippocampus data set, using RFSF (A) as the importance measure. Loci near genes participating in the same pathway (DNA replication) as the target gene (Pold3 - a DNA polymerase) are marked with circles. The 99th percentile of the values in this profile is marked with a dashed line. (B) The same target probe set, using HK as the eQTL mapping method. The traditional mapping methods based on the LOD score tend to have very broad, blunt peaks, sometimes spanning most of a chromosome. Random Forests, on the other hand, produces very sharp, narrow peaks.
Figure 4
Figure 4
Empirical cumulative distribution functions (ECDF) of enrichment P values. The P values show the degree of enrichment among high-scoring yeast eQTL for genes that map to the same KEGG pathway as the target gene (A) and genes that map to the same pathway as the known transcription factors for the target gene (B). In both scenarios RFSF achieved the best performance in recovering loci enriched for pathway-related genes.
Figure 5
Figure 5
Enrichment of KEGG pathway members in top-scoring loci in mouse tissues hippocampus, lung, regulatory T-cell, and hematopoietic stem cell. The enrichment test procedure is the same as shown in Figure 4, but here the performance is summarized as the D statistic (maximum deviation from the uniform distribution) obtained from the Kolmogorov-Smirnov test.
Figure 6
Figure 6
Enrichment of high-scoring eQTL for mutant expression changes. We used large-scale loss-of-function gene expression studies in yeast to determine whether high-scoring eQTL were near genes that, when mutated, perturbed the expression of the target gene. All methods showed significant enrichment for eQTL causing large expression changes when genes proximal to the eQTL are mutated, though the degree of enrichment varied widely. RFSF showed the most significant enrichment with P = 1.03 × 10-99.
Figure 7
Figure 7
Agreement between methods expressed as the overlap of selected loci, over all experimental data sets. In general, the multi-locus approaches showed much more consistency with each other. The average percent overlap among RFPI, RFRSS, RFSF, SPLS, lasso, and elastic net was 49% (ranging from 31% to 67%), while HK and CIM had 17% of top loci in common.
Figure 8
Figure 8
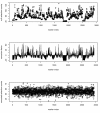
Bias estimation and correction in RFSF. Under the null hypothesis (no association between trait and genotypes), RFSF is biased towards variables with low correlation to others (top panel). The bias is estimated by fitting a forest to Gaussian noise, and a correction factor is derived by determining how much more or less frequently a marker is selected than the mean (middle panel). By subtracting the correction factor from the observed RFSF, the selection bias is removed (compare top panel to bottom panel).
Figure 9
Figure 9
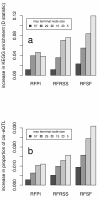
Effect of varying Random Forests tree depth on performance. The effect of varying Random Forests tree depth on performance as measured by the distributional deviation of the enrichment P values from the uniform distribution (A) and the percentage of expression traits with a cis-eQTL (B). Smaller node sizes correspond to deeper trees. The permutation importance and RSS importance improve modestly with deeper trees, whereas selection frequency shows more marked improvement with deeper trees. The improvement is measured with respect to forests that stop after the root split (nodesize 114).
Figure 10
Figure 10
Overlap of RF and linear methods while increasing RF tree depth. In general, deeper trees caused the RF importance measures to diverge from the linear methods in terms of which loci were given the top scores. The effect is particularly pronounced for RF selection frequency (RFSF).
Figure 11
Figure 11
Relationship between SNP density and analysis strategy for eQTL data. The current state of computer hardware allows little if any consideration of joint effects of markers when millions of SNPs are considered for tens of thousands of expression traits. Simple univariate tests or expert knowledge are often employed to reduce the number of considered SNPs to a range where mapping methods may be used and increased attention may be given to the interplay between loci. In the optimal case, successful application of mapping methods in many populations will yield an explicit model of the expression trait in terms of a smaller number of genetic loci, optionally including environmental effects.
Figure 12
Figure 12
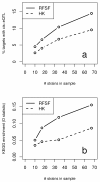
Relationship between sample size and ability to recover biologically relevant loci. Subsets of decreasing size (67, 34, 17, and 10 strains) were taken from the hippocampus eQTL study and eQTL were mapped using RFSF and HK. Performance was evaluated with the cis-eQTL and KEGG enrichment benchmarks. Both RFSF and HK improved performance when additional strains were added, though the performance RFSF was consistently better than HK in both benchmarks for all sample sizes.

References

    1. Rockman MV, Kruglyak L. Genetics of global gene expression. Nat Rev Genet. 2006;7(11):862–72. doi: 10.1038/nrg1964. - DOI - PubMed
    1. Brem RB, Storey JD, Whittle J, Kruglyak L. Genetic interactions between polymorphisms that affect gene expression in yeast. Nature. 2005;436(7051):701–3. doi: 10.1038/nature03865. - DOI - PMC - PubMed
    1. Kempermann G, Chesler EJ, Lu L, Williams RW, Gage FH. Natural variation and genetic covariance in adult hippocampal neurogenesis. Proc Natl Acad Sci USA. 2006;103(3):780–5. doi: 10.1073/pnas.0510291103. - DOI - PMC - PubMed
    1. Petretto E, Mangion J, Dickens NJ, Cook SA, Kumaran MK, Lu H, Fischer J, Maatz H, Kren V, Pravenec M, Hubner N, Aitman TJ. Heritability and tissue specificity of expression quantitative trait loci. PLoS Genet. 2006;2(10):e172. doi: 10.1371/journal.pgen.0020172. - DOI - PMC - PubMed
    1. Veyrieras JB, Kudaravalli S, Kim SY, Dermitzakis ET, Gilad Y, Stephens M, Pritchard JK. High-resolution mapping of expression-QTLs yields insight into human gene regulation. PLoS Genet. 2008;4(10):e1000214. doi: 10.1371/journal.pgen.1000214. - DOI - PMC - PubMed

Publication types

LinkOut - more resources