. 2010 Sep 17:11:505.
doi: 10.1186/1471-2164-11-505.

Homoeolog-specific transcriptional bias in allopolyploid wheat

Affiliations

Homoeolog-specific transcriptional bias in allopolyploid wheat

Alina R Akhunova et al. BMC Genomics. .

Abstract

Background: Interaction between parental genomes is accompanied by global changes in gene expression which, eventually, contributes to growth vigor and the broader phenotypic diversity of allopolyploid species. In order to gain a better understanding of the effects of allopolyploidization on the regulation of diverged gene networks, we performed a genome-wide analysis of homoeolog-specific gene expression in re-synthesized allohexaploid wheat created by the hybridization of a tetraploid derivative of hexaploid wheat with the diploid ancestor of the wheat D genome Ae. tauschii.

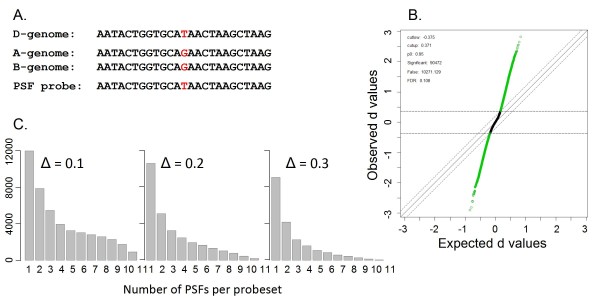
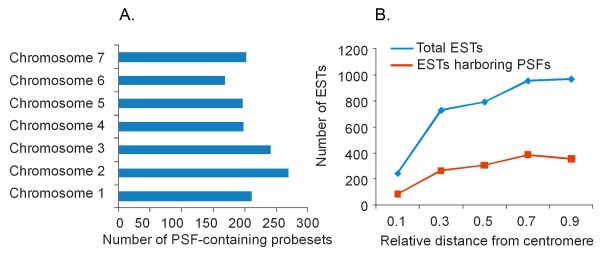
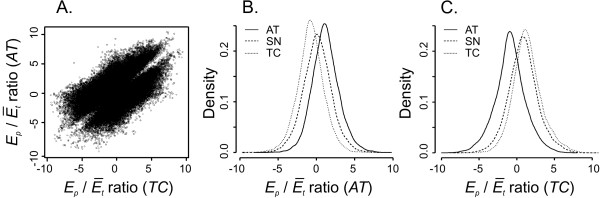
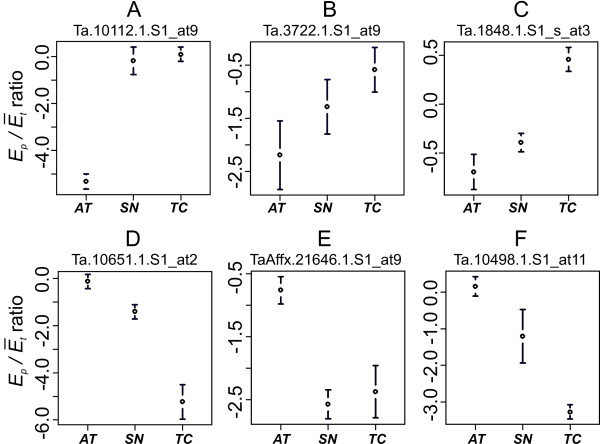
Results: Affymetrix wheat genome arrays were used for both the discovery of divergent homoeolog-specific mutations and analysis of homoeolog-specific gene expression in re-synthesized allohexaploid wheat. More than 34,000 detectable parent-specific features (PSF) distributed across the wheat genome were used to assess AB genome (could not differentiate A and B genome contributions) and D genome parental expression in the allopolyploid transcriptome. In re-synthesized polyploid 81% of PSFs detected mid-parent levels of gene expression, and only 19% of PSFs showed the evidence of non-additive expression. Non-additive expression in both AB and D genomes was strongly biased toward up-regulation of parental type of gene expression with only 6% and 11% of genes, respectively, being down-regulated. Of all the non-additive gene expression, 84% can be explained by differences in the parental genotypes used to make the allopolyploid. Homoeolog-specific co-regulation of several functional gene categories was found, particularly genes involved in photosynthesis and protein biosynthesis in wheat.

Conclusions: Here, we have demonstrated that the establishment of interactions between the diverged regulatory networks in allopolyploids is accompanied by massive homoeolog-specific up- and down-regulation of gene expression. This study provides insights into interactions between homoeologous genomes and their role in growth vigor, development, and fertility of allopolyploid species.


Figures

Figure 1
Figure 1
Identification of parent-specific features (PSFs) in diploid Ae. tauschii and tetraploid wheat Tetra-Cantach. A. Alignment of an AT-specific probe with the target sequences in the D-genome of Ae. tauschii and AB-genomes of Tetra-Cantach. Homoeolog-specific mutation discriminating both the A- and B-genomes from the D-genome is shown in red. B. The scatter plot of observed versus expected d-statistics obtained for each PM probe. Expected values were obtained by permutations of dataset. Threshold Δ = 0.2 was applied for identifying significantly different oligonucleotide features between Ae. tauschii and Tetra-Cantach. C. Frequency distribution of the number of PSFs per probeset under various values of threshold Δ.
Figure 2
Figure 2
Distribution of parent-specific features across the wheat chromosomes. A. Distribution of PSF-containing probesets among the 7 homoeologous groups of chromosomes. B. Correlation between the distribution of ESTs harboring PSFs and total ESTs along the wheat chromosomes. The distance from the centromere is given in fractions of chromosome arm length where 0 represents centromere and 1.0 represents telomere.
Figure 3
Figure 3
Comparison of Ept ratios in AT, TC and SN obtained for 40,281 probes. A. A scatterplot showing the comparison of Ept ratios calculated for AT (y-axis) and TC (x-axis) lines. B. Density distribution of Ept ratios in AT, TC and SN lines calculated for probes having perfect match with the AT sequences (AT-specific). C. Density distribution of Ept ratio in AT, TC and SN lines for probes preferentially hybridizing with the TC sequences (TC-specific).
Figure 4
Figure 4
Ept ratio estimates in AT, SN and TC for selected PSFs. The graphs are showing the means and 95% confidence intervals of Ept ratio estimates. The top three probes hybridize preferentially with TC (TC-specific); the bottom three probes hybridize preferentially with AT (AT-specific). The names of PSF probes are indicated on the top of each plot.

References

    1. Chen ZJ. Genetic and epigenetic mechanisms for gene expression and phenotypic variation in plant polyploids. Annu Rev Plant Biol. 2007;58:377–406. doi: 10.1146/annurev.arplant.58.032806.103835. - DOI - PMC - PubMed
    1. Comai L. The advantages and disadvantages of being polyploid. Nat Rev Genet. 2005;6:836–46. doi: 10.1038/nrg1711. - DOI - PubMed
    1. Osborn TC, Pires JC, Birchler JA, Auger DL, Chen ZJ, Lee HS, Comai L, Madlung A, Doerge RW, Colot V, Martienssen RA. Understanding mechanisms of novel gene expression in polyploids. Trends Genet. 2003;19:141–147. doi: 10.1016/S0168-9525(03)00015-5. - DOI - PubMed
    1. Paterson AH, Bowers JE, Chapman BA. Ancient polyploidization predating divergence of the cereals, and its consequences for comparative genomics. Proc Natl Acad Sci USA. 2004;101:9903–8. doi: 10.1073/pnas.0307901101. - DOI - PMC - PubMed
    1. Soltis DE, Bell CD, Kim S, Soltis PS. Origin and early evolution of angiosperms. Ann N Y Acad Sci. 2008;133:3–25. doi: 10.1196/annals.1438.005. - DOI - PubMed

Publication types

MeSH terms

LinkOut - more resources