

A catalytic role for Mod5 in the formation of the Tea1 cell polarity landmark
- PMID: 20850323
- PMCID: PMC3094757
- DOI: 10.1016/j.cub.2010.08.035
A catalytic role for Mod5 in the formation of the Tea1 cell polarity landmark
Abstract
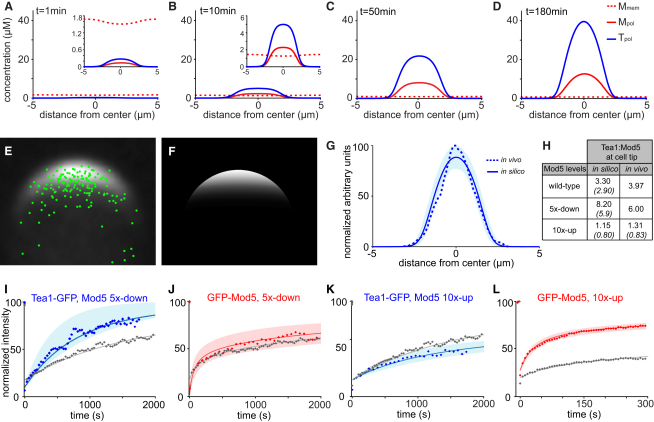
Many systems regulating cell polarity involve stable landmarks defined by internal cues. In the rod-shaped fission yeast Schizosaccharomyces pombe, microtubules regulate polarized vegetative growth via a landmark involving the protein Tea1. Tea1 is delivered to cell tips as packets of molecules associated with growing microtubule ends and anchored at the plasma membrane via a mechanism involving interaction with the membrane protein Mod5. Tea1 and Mod5 are highly concentrated in clusters at cell tips in a mutually dependent manner, but how the Tea1-Mod5 interaction contributes mechanistically to generating a stable landmark is not understood. Here, we use live-cell imaging, FRAP, and computational modeling to dissect dynamics of the Tea1-Mod5 interaction. Surprisingly, we find that Tea1 and Mod5 exhibit distinctly different turnover rates at cell tips. Our data and modeling suggest that rather than acting simply as a Tea1 receptor or as a molecular "glue" to retain Tea1, Mod5 functions catalytically to stimulate incorporation of Tea1 into a stable tip-associated cluster network. The model also suggests an emergent self-focusing property of the Tea1-Mod5 cluster network, which can increase the fidelity of polarized growth.
Copyright © 2010 Elsevier Ltd. All rights reserved.
Figures


Similar articles
-
Local and global Cdc42 guanine nucleotide exchange factors for fission yeast cell polarity are coordinated by microtubules and the Tea1-Tea4-Pom1 axis.J Cell Sci. 2018 Jul 19;131(14):jcs216580. doi: 10.1242/jcs.216580. J Cell Sci. 2018. PMID: 29930085 Free PMC article.
-
Wsh3/Tea4 is a novel cell-end factor essential for bipolar distribution of Tea1 and protects cell polarity under environmental stress in S. pombe.Curr Biol. 2005 Jun 7;15(11):1006-15. doi: 10.1016/j.cub.2005.04.061. Curr Biol. 2005. PMID: 15936270
-
Microtubules offset growth site from the cell centre in fission yeast.J Cell Sci. 2007 Jul 1;120(Pt 13):2205-13. doi: 10.1242/jcs.03464. J Cell Sci. 2007. PMID: 17591689
-
Microtubule-dependent cell morphogenesis in the fission yeast.Trends Cell Biol. 2009 Sep;19(9):447-54. doi: 10.1016/j.tcb.2009.06.003. Epub 2009 Aug 25. Trends Cell Biol. 2009. PMID: 19713114 Review.
-
Cell shape and cell division in fission yeast.Curr Biol. 2009 Sep 15;19(17):R823-7. doi: 10.1016/j.cub.2009.08.012. Curr Biol. 2009. PMID: 19906584 Free PMC article. Review.
Cited by
-
Microtubule stabilization in vivo by nucleation-incompetent γ-tubulin complex.J Cell Sci. 2011 Apr 15;124(Pt 8):1207-13. doi: 10.1242/jcs.083741. J Cell Sci. 2011. PMID: 21444751 Free PMC article.
-
Superresolution microscopy reveals a dynamic picture of cell polarity maintenance during directional growth.Sci Adv. 2015 Nov 13;1(10):e1500947. doi: 10.1126/sciadv.1500947. eCollection 2015 Nov. Sci Adv. 2015. PMID: 26665168 Free PMC article.
-
The Kelch Repeat Protein VdKeR1 Is Essential for Development, Ergosterol Metabolism, and Virulence in Verticillium dahliae.J Fungi (Basel). 2024 Sep 9;10(9):643. doi: 10.3390/jof10090643. J Fungi (Basel). 2024. PMID: 39330403 Free PMC article.
-
How and why cells grow as rods.BMC Biol. 2014 Aug 2;12:54. doi: 10.1186/s12915-014-0054-8. BMC Biol. 2014. PMID: 25185019 Free PMC article. Review.
-
Noise reduction in the intracellular pom1p gradient by a dynamic clustering mechanism.Dev Cell. 2012 Mar 13;22(3):558-72. doi: 10.1016/j.devcel.2012.01.001. Epub 2012 Feb 16. Dev Cell. 2012. PMID: 22342545 Free PMC article.
References
-
- Cheung A.Y., Duan Q.H., Costa S.S., de Graaf B.H., Di Stilio V.S., Feijo J., Wu H.M. The dynamic pollen tube cytoskeleton: Live cell studies using actin-binding and microtubule-binding reporter proteins. Mol. Plant. 2008;1:686–702. - PubMed
-
- Fischer R., Zekert N., Takeshita N. Polarized growth in fungi–interplay between the cytoskeleton, positional markers and membrane domains. Mol. Microbiol. 2008;68:813–826. - PubMed
-
- Siegrist S.E., Doe C.Q. Microtubule-induced cortical cell polarity. Genes Dev. 2007;21:483–496. - PubMed
-
- Basu R., Chang F. Shaping the actin cytoskeleton using microtubule tips. Curr. Opin. Cell Biol. 2007;19:88–94. - PubMed
Publication types
MeSH terms
Substances
Grants and funding
LinkOut - more resources
Full Text Sources
Molecular Biology Databases
Miscellaneous
