Review
. 2011 Mar;273(1-2):123-33.
doi: 10.1016/j.heares.2010.08.008. Epub 2010 Sep 17.

A bird brain's view of auditory processing and perception

Affiliations
Review

A bird brain's view of auditory processing and perception

Katherine Nagel et al. Hear Res. 2011 Mar.

Abstract

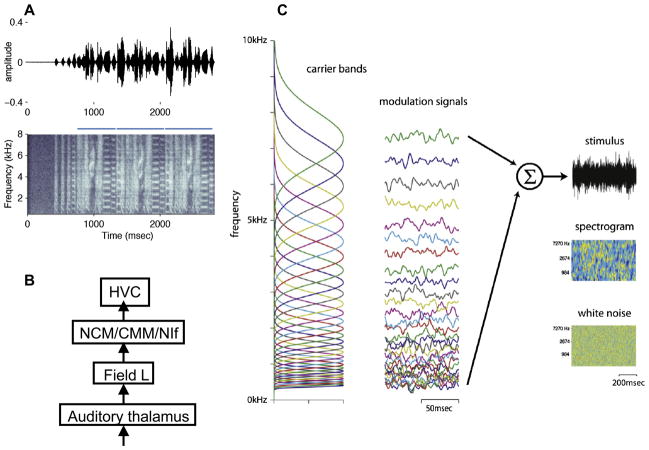
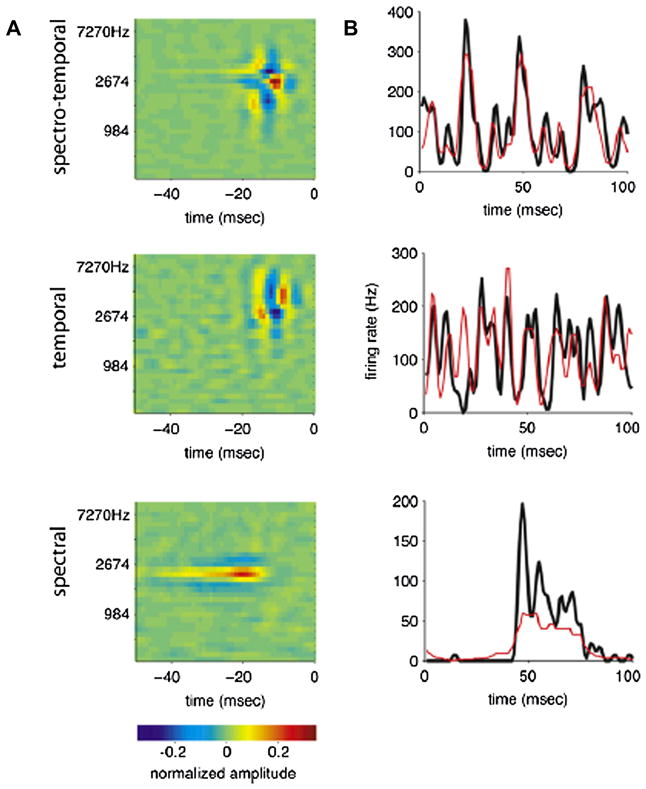
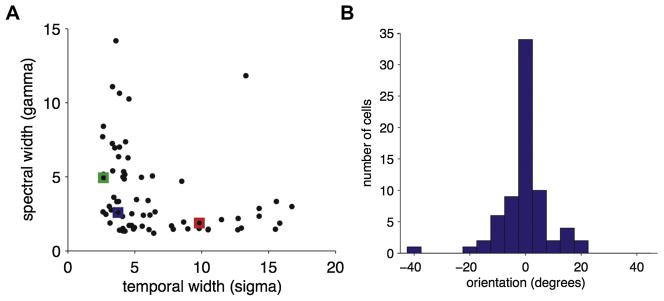
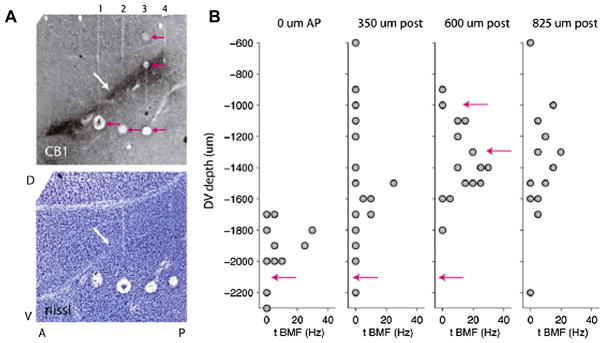
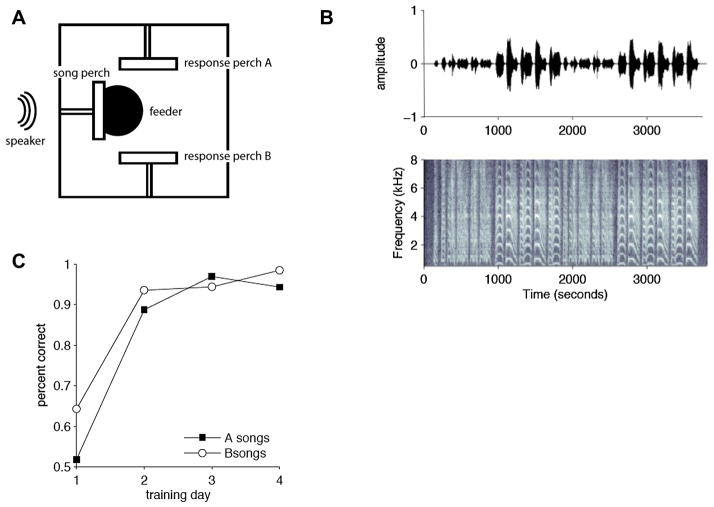
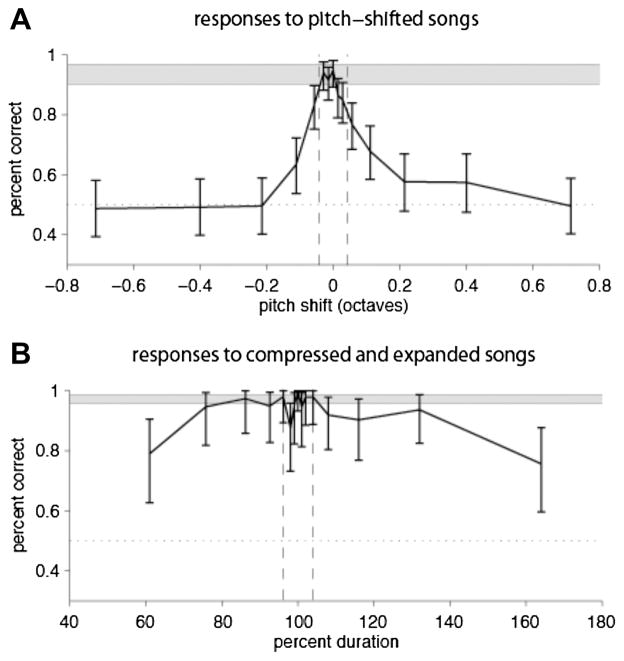
By studying the primary forebrain auditory area of songbirds, field L, using a song-inspired synthetic stimulus and reverse correlation techniques, we found a surprisingly systematic organization of this area, with nearly all neurons narrowly tuned along the spectral dimension, the temporal dimension, or both; there were virtually no strongly orientation-sensitive cells, and in the areas that we recorded, cells broadly tuned in both time and frequency were rare. In addition, cells responsive to fast temporal frequencies predominated only in the field L input layer, suggesting that neurons with fast and slow responses are concentrated in different regions. Together with other songbird data and work from chicks and mammals, these findings suggest that sampling a range of temporal and spectral modulations, rather than orientation in time-frequency space, is the organizing principle of forebrain auditory sensitivity. We then examined the role of these acoustic parameters important to field L organization in a behavioral task. Birds' categorization of songs fell off rapidly when songs were altered in frequency, but, despite the temporal sensitivity of field L neurons, the same birds generalized well to songs that were significantly changed in timing. These behavioral data point out that we cannot assume that animals use the information present in particular neurons without specifically testing perception.


Figures

Fig. 1
Fig. 1
A) Typical song of a zebra finch, shown both as an oscillogram (sound pressure vs time, top panel) and spectrograms (frequency vs time, with amplitude indicated by relative lightness, lower panel). Each song is composed of several repeated sequences of syllables known as ‘motifs’, indicated by the blue bars over the spectrograms. This song is also song A of the behavioral experiments described later. B) Simplified schematic of the songbird central auditory hierarchy. The sensorimotor song control nucleus HVC is shown here as the highest level, and receives input directly or indirectly from a less selective sensorimotor nucleus known as NIf (nucleus interface) and the high-level auditory nuclei CM (caudal mesopallium) and NCM (caudomedial nidopallium). CM and NCM receive input from the primary auditory cortex equivalent of birds, known as field L. C) Schematic of naturalistic stimulus construction. Thirty-two overlapping frequency bands (left-hand column) were modulated by independent amplitude envelopes (middle column). The stimulus was the sum of these bands, shown as both an oscillogram (top panel) and as a spectrogram (second panel) in the right-hand column. The naturalistic stimulus was smoother in both time and frequency than a pure white noise stimulus (typical noise segment in bottom panel).
Fig. 2
Fig. 2
Examples of three common types of spectro-temporal receptive fields. A) Spectro-temporal receptive field (STRF) and real and predicted peri-stimulus time histograms (PSTHs) of a cell sensitive to both spectral and temporal modulations. The central positive peak of the STRF is flanked by negative regions in both spectrum and time. The PSTH shows the cell’s average response to 50 repeated stimulus segments (right-hand panel, black line). The prediction (red line) is generated by convolving the STRF with this stimulus and passing the result through a nonlinearity derived from the data (see Nagel and Doupe, 2008). The correlation coefficient between prediction and PSTH for this cell was 0.70, making it one of the better fits in our population. B) A cell sensitive to temporal modulations. Positive and negative subfields of the STRF are arranged sequentially in time. The correlation coefficient between PSTH and prediction for this cell was 0.48, just below the population mean of 0.52 ± 0.14 (standard deviation). C) A cell sensitive to spectral modulations. The positive region of the STRF is extended in time and flanked by negative spectral sidebands. The correlation coefficient between prediction and PSTH for this cell was 0.58. The color scale below the spectrograms shows the normalized amplitude of the neural response.
Fig. 3
Fig. 3
A) Spectral width versus temporal width for all STRFs (n = 71). Width parameters were obtained by fitting the bivariate Mexican hat model to each STRF. They show an L-shaped distribution, with most cells narrowly tuned in spectrum or time, or both. Example cells from Figure 2 are indicated by blue (spectro-temporal, example from Figure 2A), green (temporal, example from Figure 2B), and red (spectral, example from Figure 2C) squares. B) Distribution of orientation parameters obtained by fitting a version of the bivariate Mexican hat model including an orientation term. Most cells show orientations near 0, indicating that they are aligned largely along the temporal and/or spectral axes.
Fig. 4
Fig. 4
A) Histological sections showing the regions of field L and the locations of electrode penetrations in a mapping experiment. (Top panel) Slide stained with an antibody to CB1, the cannabinoid receptor, which selectively labels the input area L2 (white arrow). Above the stained area is area L1, and below it is area L3. Tracks of four electrodes can be seen crossing the three layers of field L. Pink arrows indicate marker lesions. (Bottom panel) Nissl-stained slide adjacent to above showing the laminae that define the borders of the field L complex, as well as the diagonal fiber tract immediately adjacent to field L2 (white arrow). Lesions from all four electrodes are visible. B) Temporal BMF of raw multiunit STAs as a function of recording depth on each of four electrodes. Pink arrows mark the depths of the lesions shown in the top panel of (A). Sites with higher best modulation frequencies are found within a restricted range of depths that is deeper and narrower for the anterior electrodes and shallower and wider for the posterior electrodes. The location of these sites containing cells with faster preferred modulation rates corresponds well to the location of the darkly-stained area in the CB1 slide, suggesting that these “faster sites” are localized to area L2.
Fig. 5
Fig. 5
A) Diagram of the operant cage seen from above. Three perches are located on three sides of the cage. After a hop on the central perch, the computer plays a song from the speaker located directly in front of it. The bird can respond by hopping on either of the two response perches. After a correct answer, a feeder beneath the cage is raised for 2–5 seconds, allowing the bird access to seed. After an incorrect answer, all perches cease to function for a 20–30 second time-out. B) Oscillogram and spectrogram of song B as used for training (song A is in Figure 1A). The goal of our study was to train birds to associate each response perch with the songs of one individual: the two individuals differed in the temporal pattern and frequency content of their syllables. 50 songs from each individual were used in training, to avoid over-training on a single song rendition. C) Learning curve for one representative individual showing percent of correct responses on A (black) and B (white) songs as a function of the number of days of discrimination training. By the second day of training, this bird performed well above chance on both stimulus types. This bird had 9 days of pre-training (song, food, and sequence modes, as described in text) before beginning discrimination trials. All birds showed greater-than-chance performance by the second day of training.
Fig. 6
Fig. 6
A) Performance of a typical bird on pitch-shifted probe stimuli. Percent correct as a function of pitch shift (black line). Error bars represent 95% confidence intervals on percent correct obtained by fitting data to a binomial distribution. The blue bar at the top represents the mean +/− one standard deviation of the bird’s performance on control training trials, averaged across days (n=16). Dashed lines at 97% and 103% represent +/− one standard deviation of the range of natural pitch variation. The bird’s performance overlapped with control performance within this range and fell off rapidly outside it. All birds showed a decrease in performance for songs outside the range of natural variability and chance behavior for the largest pitch shifts. B) Performance of a typical bird for duration probe stimuli. Percent correct as a function of song duration (black line). Error bars and blue bar as described in the legend for Figure 6A. Dashed lines representing the range of natural variability are at 96% and 104%. From 76 to 132% durations, the bird’s performance on probes overlapped with her performance on control trials, and she performed significantly above chance on all probes. All birds performed significantly above chance for all duration probe stimuli, although like the example bird shown, their performance decreased below control levels for the largest changes, i.e., 61% and 164% duration.

References

    1. Amin N, Theunissen FE. Selectivity for natural sounds in the songbird auditory forebrain is strongly shaped by the acoustic environment. Society for Neuroscience Abstract. 2008:99.8.
    1. Atencio CA, Sharpee TO, Schreiner CE. Hierarchical computation in the canonical auditory cortical circuit. Proc Natl Acad Sci U S A. 2009 Nov 16; [Epub ahead of print] - PMC - PubMed
    1. Avedaño C, Deng L, Hermansky H, Gold B. Speech Processing in the Auditory System. New York, NY: Springer-Verlag; 2004. The analysis and representation of speech.
    1. Beecher MD, Campbell SE, Stoddard PK. Correlation of song learning and territory establishment strategies in the song sparrow. Proc Natl Acad Sci U S A. 1994 Feb 15;91(4):1450–4. - PMC - PubMed
    1. Brenowitz EA. Altered perception of species-specific song by female birds after lesions of a forebrain nucleus. Science. 1991;251(4991):303–5. - PubMed

Publication types