

A differential geometric approach to automated segmentation of human airway tree
- PMID: 20851792
- PMCID: PMC3271357
- DOI: 10.1109/TMI.2010.2076300
A differential geometric approach to automated segmentation of human airway tree
Abstract
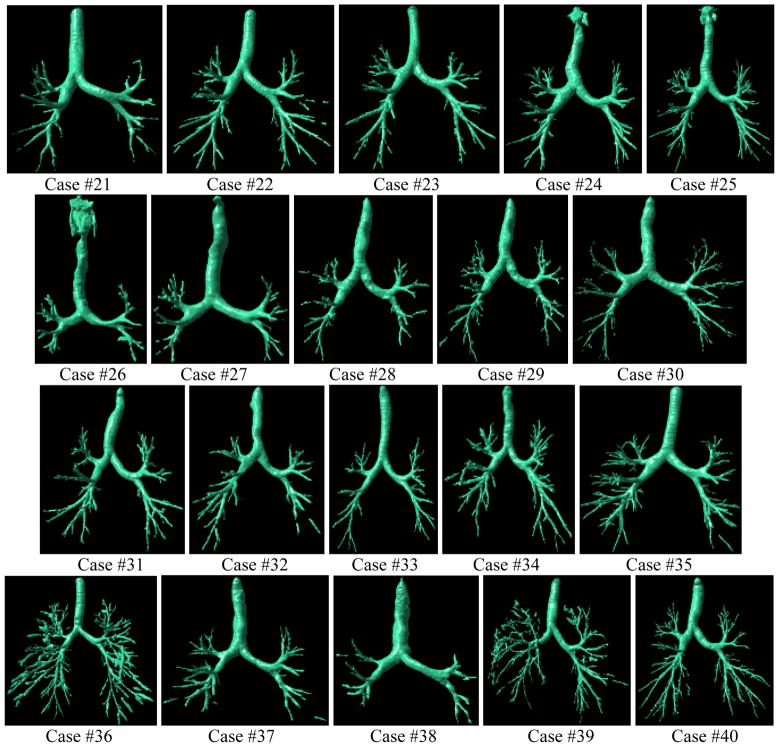
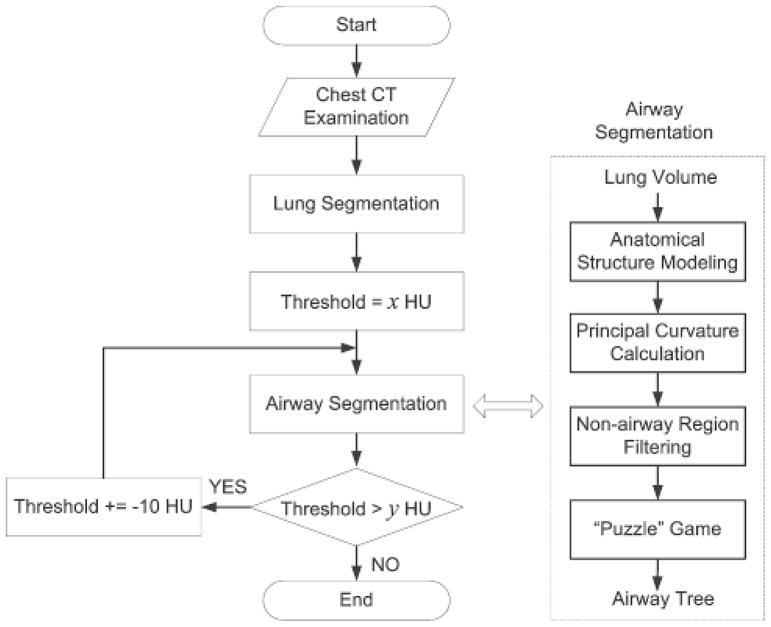
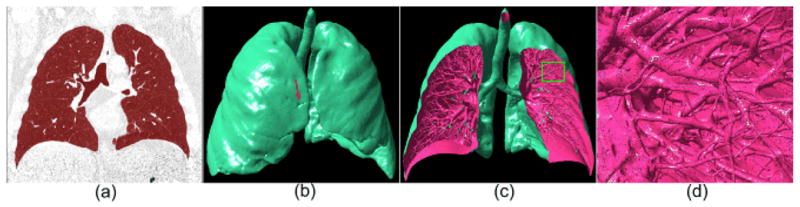
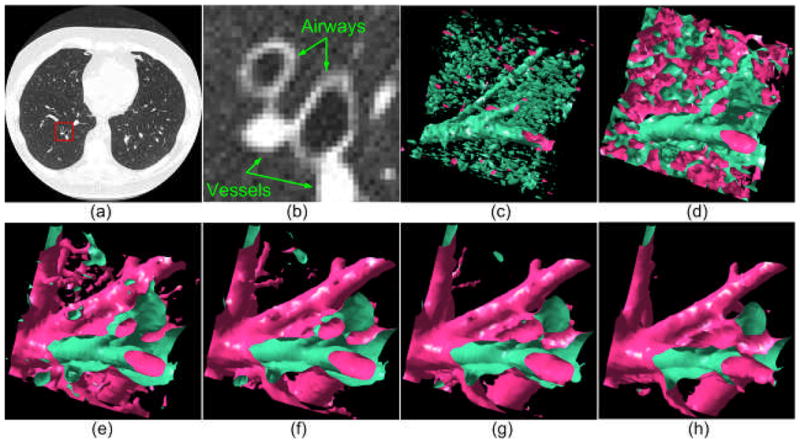
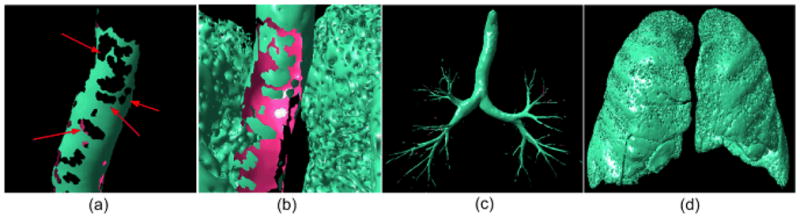
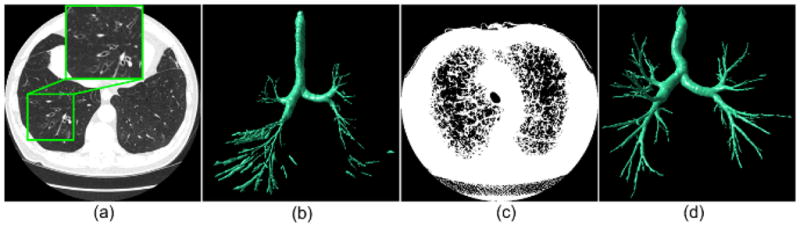
Airway diseases are frequently associated with morphological changes that may affect the physiology of the lungs. Accurate characterization of airways may be useful for quantitatively assessing prognosis and for monitoring therapeutic efficacy. The information gained may also provide insight into the underlying mechanisms of various lung diseases. We developed a computerized scheme to automatically segment the 3-D human airway tree depicted on computed tomography (CT) images. The method takes advantage of both principal curvatures and principal directions in differentiating airways from other tissues in geometric space. A "puzzle game" procedure is used to identify false negative regions and reduce false positive regions that do not meet the shape analysis criteria. The negative impact of partial volume effects on small airway detection is partially alleviated by repeating the developed differential geometric analysis on lung anatomical structures modeled at multiple iso-values (thresholds). In addition to having advantages, such as full automation, easy implementation and relative insensitivity to image noise and/or artifacts, this scheme has virtually no leakage issues and can be easily extended to the extraction or the segmentation of other tubular type structures (e.g., vascular tree). The performance of this scheme was assessed quantitatively using 75 chest CT examinations acquired on 45 subjects with different slice thicknesses and using 20 publicly available test cases that were originally designed for evaluating the performance of different airway tree segmentation algorithms.
Figures
Similar articles
-
Automatic segmentation of airway tree based on local intensity filter and machine learning technique in 3D chest CT volume.Int J Comput Assist Radiol Surg. 2017 Feb;12(2):245-261. doi: 10.1007/s11548-016-1492-2. Epub 2016 Oct 28. Int J Comput Assist Radiol Surg. 2017. PMID: 27796791
-
Quantitative analysis of pulmonary airway tree structures.Comput Biol Med. 2006 Sep;36(9):974-96. doi: 10.1016/j.compbiomed.2005.05.004. Epub 2005 Aug 1. Comput Biol Med. 2006. PMID: 16076463
-
A hybrid method for airway segmentation and automated measurement of bronchial wall thickness on CT.Med Image Anal. 2015 Aug;24(1):1-17. doi: 10.1016/j.media.2015.05.003. Epub 2015 May 14. Med Image Anal. 2015. PMID: 26026778 Free PMC article.
-
New frontiers in CT imaging of airway disease.Eur Radiol. 2002 May;12(5):1022-44. doi: 10.1007/s00330-002-1342-1. Epub 2002 Mar 15. Eur Radiol. 2002. PMID: 11976844 Review.
-
High-resolution computed tomography of the airways.J Thorac Imaging. 1993 Summer;8(3):213-29. doi: 10.1097/00005382-199322000-00006. J Thorac Imaging. 1993. PMID: 8320764 Review.
Cited by
-
Automated lobe-based airway labeling.Int J Biomed Imaging. 2012;2012:382806. doi: 10.1155/2012/382806. Epub 2012 Oct 9. Int J Biomed Imaging. 2012. PMID: 23093951 Free PMC article.
-
Illustration of the obstacles in computerized lung segmentation using examples.Med Phys. 2012 Aug;39(8):4984-91. doi: 10.1118/1.4737023. Med Phys. 2012. PMID: 22894423 Free PMC article.
-
A "loop" shape descriptor and its application to automated segmentation of airways from CT scans.Med Phys. 2015 Jun;42(6):3076-84. doi: 10.1118/1.4921139. Med Phys. 2015. PMID: 26127059 Free PMC article.
-
Graph-Based Airway Tree Reconstruction From Chest CT Scans: Evaluation of Different Features on Five Cohorts.IEEE Trans Med Imaging. 2015 May;34(5):1063-76. doi: 10.1109/TMI.2014.2374615. Epub 2014 Nov 25. IEEE Trans Med Imaging. 2015. PMID: 25438305 Free PMC article.
-
Bidirectional elastic image registration using B-spline affine transformation.Comput Med Imaging Graph. 2014 Jun;38(4):306-14. doi: 10.1016/j.compmedimag.2014.01.002. Epub 2014 Jan 25. Comput Med Imaging Graph. 2014. PMID: 24530210 Free PMC article.
References
-
- Estimates for chronic obstructive pulmonary disease, asthma, pneumonia/influenza and other lung diseases are from Chart Book, 2007. National Heart, Lung and Blood Institute; 2007.
-
- Hoffman EA, Mclennan G. Assessment of the Pulmonary Structure-Function Relationship and Clinical Outcomes Measures: Quantitative Volumetric CT of the Lung. Academic Radiology. 1997;4(11):758–776. - PubMed
-
- Hasegawa M, Nasuhara Y, Onodera Y, Makita H, Nagai K, Fuke S, Ito Y, Betsuyaku T, Nishimura M. Airflow Limitation and Airway Dimensions in Chronic Obstructive Pulmonary Disease. Journal of Respiratory and Critical Care Medicine. 2006;173(12):1309–1315. - PubMed
-
- Nakano Y, Muro S, Sakai H, Hirai T, Chin K, Tsukino M, Nishimura K, Itoh H, Pare PD, Hogg JC, Mishima M. Computed Tomographic Measurements of Airway Dimensions and Emphysema in Smokers. Correlation with Lung Function. American Journal of Repatriation Critical Care Medicine. 2000;162(3):1102–8. - PubMed
-
- Li Q, Li F, Suzuki K, Shiraishi J, Abe H, Engelmann R, Nie Y, MacMahon H, Doi K. Computer-aided Diagnosis in Thoracic CT. Seminars in Ultrasound, CT, and MR. 2005;26(5):357–363. - PubMed
Publication types
MeSH terms
Grants and funding
LinkOut - more resources
Full Text Sources
Other Literature Sources
Medical
