

Social organization in a flatworm: trematode parasites form soldier and reproductive castes
- PMID: 20851830
- PMCID: PMC3030857
- DOI: 10.1098/rspb.2010.1753
Social organization in a flatworm: trematode parasites form soldier and reproductive castes
Abstract
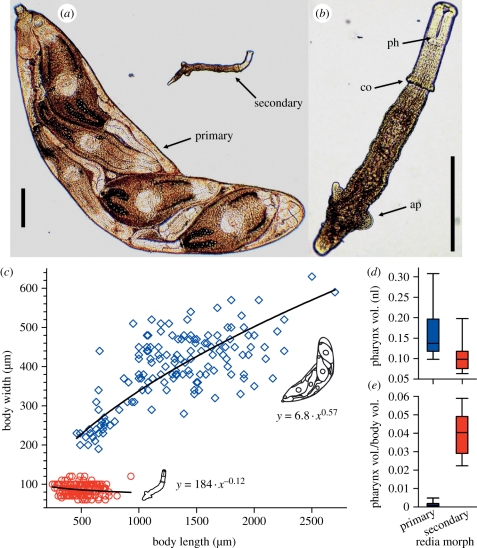
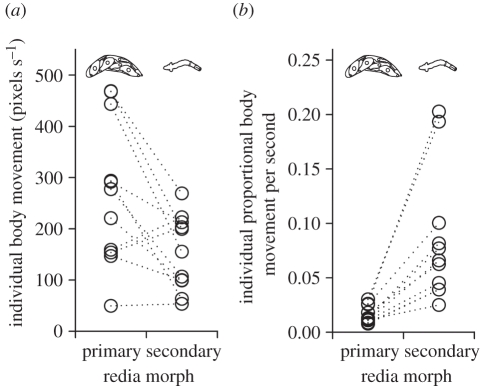
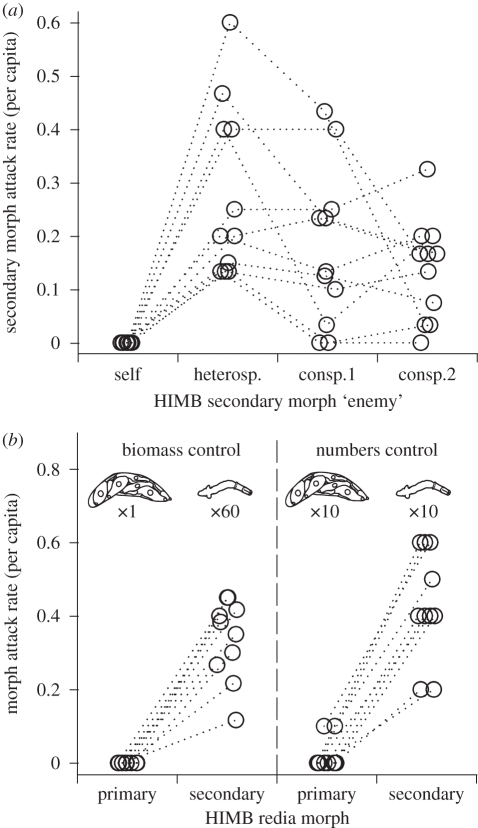
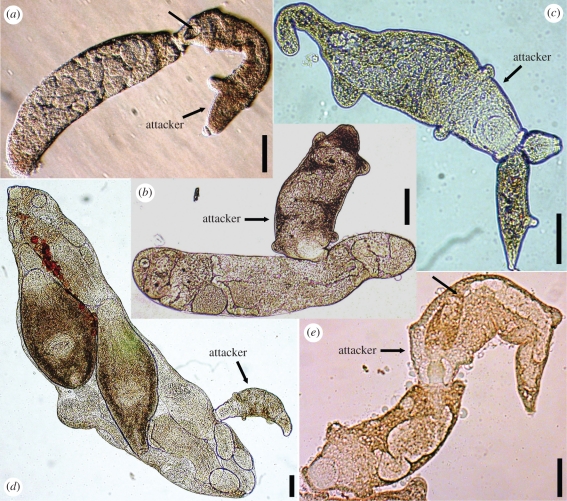
In some of the most complex animal societies, individuals exhibit a cooperative division of labour to form castes. The most pronounced types of caste formation involve reproductive and non-reproductive forms that are morphologically distinct. In colonies comprising separate or mobile individuals, this type of caste formation has been recognized only among the arthropods, sea anemones and mole-rats. Here, we document physical and behavioural caste formation in a flatworm. Trematode flatworm parasites undergo repeated clonal reproduction of 'parthenitae' within their molluscan hosts forming colonies. We present experimental and observational data demonstrating specialization among trematode parthenitae to form distinct soldier and reproductive castes. Soldiers do not reproduce, have relatively large mouthparts, and are much smaller and thinner than reproductives. Soldiers are also more active, and are disproportionally common in areas of the host where invasions occur. Further, only soldiers readily and consistently attack heterospecifics and conspecifics from other colonies. The division of labour described here for trematodes is strongly analogous to that characterizing other social systems with a soldier caste. The parallel caste formation in these systems, despite varying reproductive mode and taxonomic affiliation, indicates the general importance of ecological factors in influencing the evolution of social behaviour. Further, the 'recognition of self' and the defence of the infected host body from invading parasites are comparable to aspects of immune defence. A division of labour is probably widespread among trematodes and trematode species encompass considerable taxonomic, life history and environmental diversity. Trematodes should therefore provide new, fruitful systems to investigate the ecology and evolution of sociality.
Figures
Similar articles
-
Evolution, phylogenetic distribution and functional ecology of division of labour in trematodes.Parasit Vectors. 2019 Jan 4;12(1):5. doi: 10.1186/s13071-018-3241-6. Parasit Vectors. 2019. PMID: 30609937 Free PMC article. Review.
-
Trematodes with a reproductive division of labour: heterophyids also have a soldier caste and early infections reveal how colonies become structured.Int J Parasitol. 2017 Jan;47(1):41-50. doi: 10.1016/j.ijpara.2016.10.003. Epub 2016 Nov 30. Int J Parasitol. 2017. PMID: 27914977
-
Caste ratio adjustments in response to perceived and realised competition in parasites with division of labour.J Anim Ecol. 2018 Sep;87(5):1429-1439. doi: 10.1111/1365-2656.12873. Epub 2018 Jun 29. J Anim Ecol. 2018. PMID: 29888446
-
The physical soldier caste of an invasive, human-infecting flatworm is morphologically extreme and obligately sterile.Proc Natl Acad Sci U S A. 2024 Jul 30;121(31):e2400953121. doi: 10.1073/pnas.2400953121. Epub 2024 Jul 23. Proc Natl Acad Sci U S A. 2024. PMID: 39042696 Free PMC article.
-
A molecular concept of caste in insect societies.Curr Opin Insect Sci. 2018 Feb;25:42-50. doi: 10.1016/j.cois.2017.11.010. Epub 2017 Nov 26. Curr Opin Insect Sci. 2018. PMID: 29602361 Review.
Cited by
-
Host and parasite identity interact in scale-dependent fashion to determine parasite community structure.Oecologia. 2024 Jan;204(1):199-211. doi: 10.1007/s00442-023-05499-3. Epub 2024 Jan 11. Oecologia. 2024. PMID: 38206416 Free PMC article.
-
The diverse echinostomes from East Africa: With a focus on species that use Biomphalaria and Bulinus as intermediate hosts.Acta Trop. 2019 May;193:38-49. doi: 10.1016/j.actatropica.2019.01.025. Epub 2019 Jan 30. Acta Trop. 2019. PMID: 30710531 Free PMC article.
-
Abundance and Annual Distribution of Freshwater Snails and Some Trematode Cercariae at Damietta Governorate, Egypt.Helminthologia. 2021 Sep 30;58(3):233-247. doi: 10.2478/helm-2021-0026. eCollection 2021 Sep. Helminthologia. 2021. PMID: 34934387 Free PMC article.
-
Behavioural plasticity of social trematodes depends upon social context.Biol Lett. 2012 Dec 12;9(1):20121027. doi: 10.1098/rsbl.2012.1027. Print 2013 Feb 23. Biol Lett. 2012. PMID: 23234865 Free PMC article.
-
The validity and value of inclusive fitness theory.Proc Biol Sci. 2011 Nov 22;278(1723):3313-20. doi: 10.1098/rspb.2011.1465. Epub 2011 Sep 14. Proc Biol Sci. 2011. PMID: 21920980 Free PMC article. Review.
References
-
- Wilson E. O. 1971. The insect societies. Cambridge, MA: Belknap Press of Harvard University Press
-
- Oster G. F., Wilson E. O. 1978. Caste and ecology in the social insects. Monographs in population biology, 12. Princeton, NJ: Princeton University Press - PubMed
-
- Alexander R. D., Noonan K. M., Crespi B. J. 1991. The evolution of eusociality. In The biology of the naked mole-rat (eds Sherman P. W., Jarvis J. U. M., Alexander R. D.), pp. 3–44 Princeton, NJ: Princeton University Press
-
- Michener C. D. 1969. Comparative social behavior of bees. Annu. Rev. Entomol. 14, 299–34210.1146/annurev.en.14.010169.001503 (doi:10.1146/annurev.en.14.010169.001503) - DOI - DOI
-
- Korb J., Heinze J. 2008. The ecology of social life: a synthesis. In Ecology of social evolution (eds Heinze J., Korb J.), pp. 245–259 Berlin, Germany: Springer
Publication types
MeSH terms
LinkOut - more resources
Full Text Sources
Other Literature Sources
