

IGFBP-3 can either inhibit or enhance EGF-mediated growth of breast epithelial cells dependent upon the presence of fibronectin
- PMID: 20851879
- PMCID: PMC2998100
- DOI: 10.1074/jbc.M110.177311
IGFBP-3 can either inhibit or enhance EGF-mediated growth of breast epithelial cells dependent upon the presence of fibronectin
Abstract
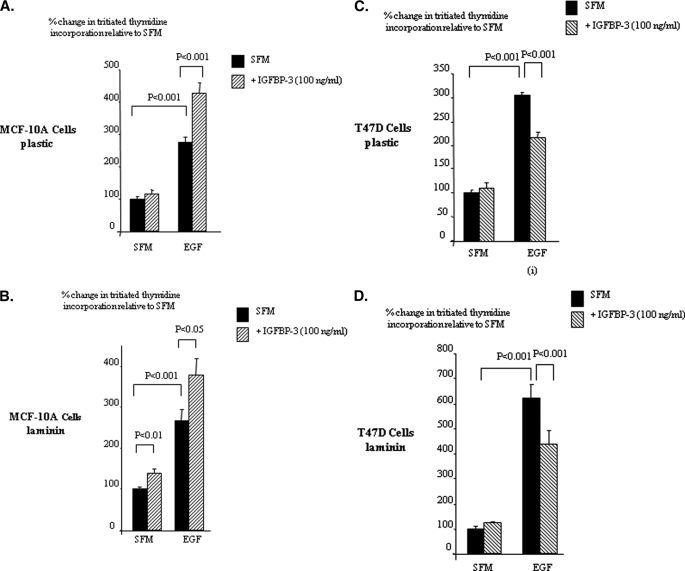
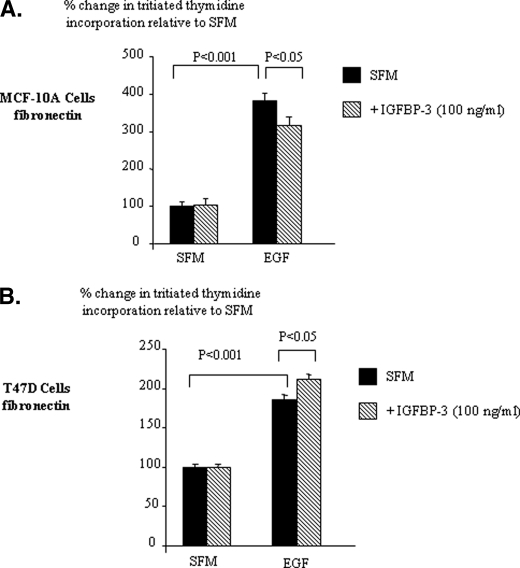
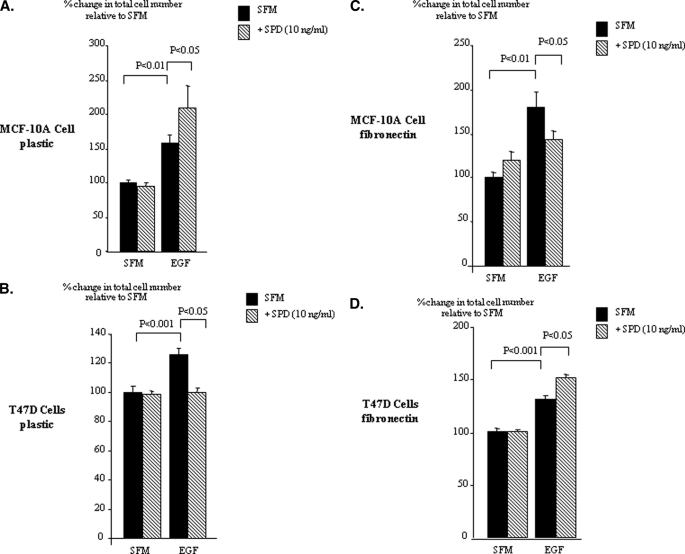
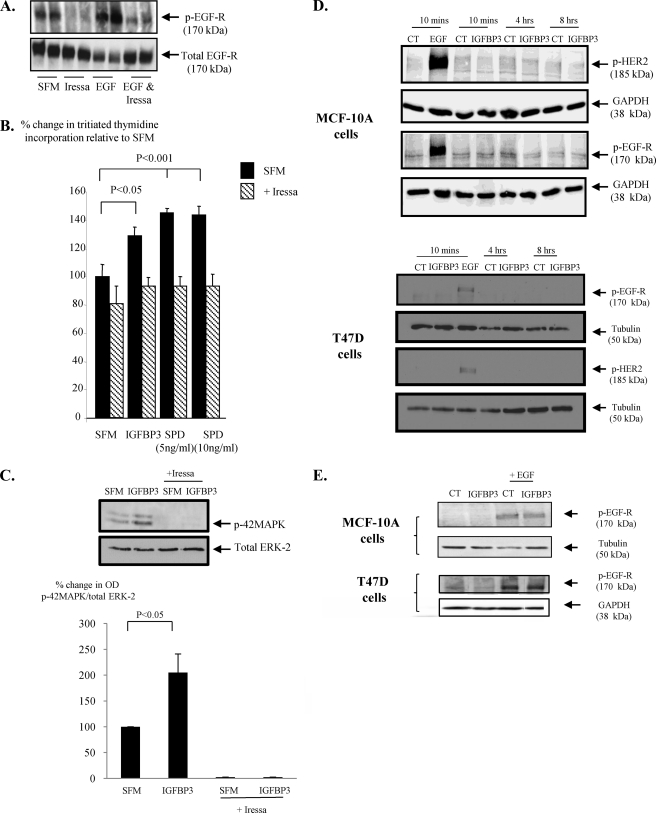
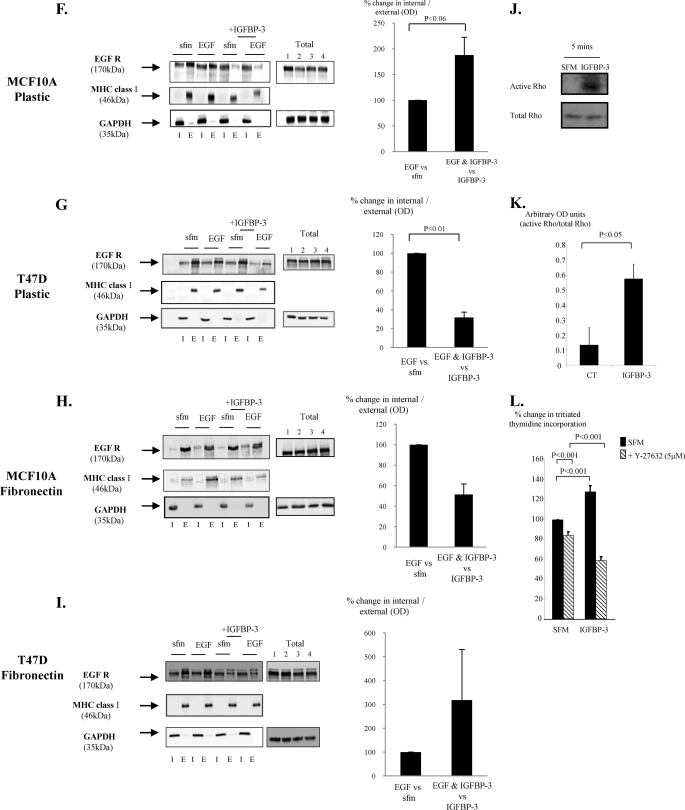
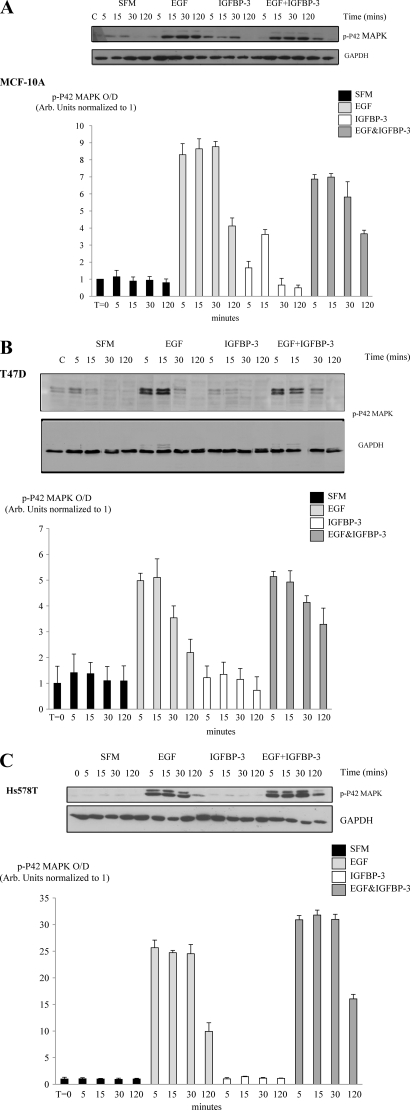
Progression of breast cancer is associated with remodeling of the extracellular matrix, often involving a switch from estrogen dependence to a dependence on EGF receptor (EGFR)/HER-2 and is accompanied by increased expression of the main binding protein for insulin-like growth factors (IGFBP-3). We have examined the effects of IGFBP-3 on EGF responses of breast epithelial cells in the context of changes in the extracellular matrix. On plastic and laminin with MCF-10A normal breast epithelial cells, EGF and IGFBP-3 each increased cell growth and together produced a synergistic response, whereas with T47D breast cancer cells IGFBP-3 alone had no effect, but the ability of EGF to increase cell proliferation was markedly inhibited in the presence of IGFBP-3. In contrast on fibronectin with MCF-10A cells, IGFBP-3 alone inhibited cell growth and blocked EGF-induced proliferation. With the cancer cells, IGFBP-3 alone had no effect but enhanced the EGF-induced increase in cell growth. The insulin-like growth factor-independent effects of IGFBP-3 alone on cell proliferation were completely abrogated in the presence of an EGFR, tyrosine kinase inhibitor, Iressa. Although IGFBP-3 did not affect EGFR phosphorylation [Tyr(1068)], it was found to modulate receptor internalization and was associated with activation of Rho and subsequent changes in MAPK phosphorylation. The levels of fibronectin and IGFBP-3 within breast tumors may determine their dependence on EGFR and their response to therapies targeting this receptor.
Figures

Similar articles
-
Inhibition of insulin-like growth factor-binding protein-3 signaling through sphingosine kinase-1 sensitizes triple-negative breast cancer cells to EGF receptor blockade.Mol Cancer Ther. 2014 Feb;13(2):316-28. doi: 10.1158/1535-7163.MCT-13-0367. Epub 2013 Dec 12. Mol Cancer Ther. 2014. PMID: 24337110
-
Insulin-like growth factor-binding protein-3 potentiates epidermal growth factor action in MCF-10A mammary epithelial cells. Involvement of p44/42 and p38 mitogen-activated protein kinases.J Biol Chem. 2003 Jan 31;278(5):2969-76. doi: 10.1074/jbc.M210739200. Epub 2002 Nov 13. J Biol Chem. 2003. PMID: 12433918
-
Insulin-like growth factor binding protein-3 expression is associated with growth stimulation of T47D human breast cancer cells: the role of altered epidermal growth factor signaling.J Clin Endocrinol Metab. 2004 Apr;89(4):1950-6. doi: 10.1210/jc.2003-030914. J Clin Endocrinol Metab. 2004. PMID: 15070968
-
Insulin-like growth factor binding protein 3 has opposing actions on malignant and nonmalignant breast epithelial cells that are each reversible and dependent upon cholesterol-stabilized integrin receptor complexes.Endocrinology. 2006 Jul;147(7):3484-500. doi: 10.1210/en.2006-0005. Epub 2006 Apr 13. Endocrinology. 2006. PMID: 16614079
-
An update of the mechanisms of resistance to EGFR-tyrosine kinase inhibitors in breast cancer: Gefitinib (Iressa) -induced changes in the expression and nucleo-cytoplasmic trafficking of HER-ligands (Review).Int J Mol Med. 2007 Jul;20(1):3-10. Int J Mol Med. 2007. PMID: 17549382 Review.
Cited by
-
β-D-glucan inhibits endocrine-resistant breast cancer cell proliferation and alters gene expression.Int J Oncol. 2014 Apr;44(4):1365-75. doi: 10.3892/ijo.2014.2294. Epub 2014 Feb 10. Int J Oncol. 2014. PMID: 24534923 Free PMC article.
-
Insulin-Like Growth Factor Binding Protein-3 (IGFBP-3): Unraveling the Role in Mediating IGF-Independent Effects Within the Cell.Front Cell Dev Biol. 2020 May 5;8:286. doi: 10.3389/fcell.2020.00286. eCollection 2020. Front Cell Dev Biol. 2020. PMID: 32478064 Free PMC article. Review.
-
Deregulation of IGF-binding proteins -2 and -5 contributes to the development of endocrine resistant breast cancer in vitro.Oncotarget. 2016 May 31;7(22):32129-43. doi: 10.18632/oncotarget.8534. Oncotarget. 2016. PMID: 27050076 Free PMC article.
-
Estrogen Receptor-β and the Insulin-Like Growth Factor Axis as Potential Therapeutic Targets for Triple-Negative Breast Cancer.Crit Rev Oncog. 2015;20(5-6):373-90. doi: 10.1615/CritRevOncog.v20.i5-6.100. Crit Rev Oncog. 2015. PMID: 27279236 Free PMC article. Review.
-
Histone deacetylase inhibitors enhance the apoptotic activity of insulin-like growth factor binding protein-3 by blocking PKC-induced IGFBP-3 degradation.Int J Cancer. 2012 Nov 15;131(10):2253-63. doi: 10.1002/ijc.27509. Epub 2012 Mar 28. Int J Cancer. 2012. PMID: 22362554 Free PMC article.
References
-
- Pollak M. N. (2004) Novartis Found. Symp. 262, 84–98; discussion 98–107, 265–268, Review - PubMed
-
- Hynes N. E., Stern D. F. (1994) Biochim. Biophys. Acta 1198, 165–184 - PubMed
-
- Firth S. M., Baxter R. C. (2002) Endocr. Rev. 23, 824–854 - PubMed
-
- Perks C., Holly J. (2003) Horm. Metab. Res. 35, 828–835 - PubMed
-
- Burrows C., Holly J. M., Laurence N. J., Vernon E. G., Carter J. V., Clark M. A., McIntosh J., McCaig C., Winters Z. E., Perks C. M. (2006) Endocrinology 147, 3484–3500 - PubMed
Publication types
MeSH terms
Substances
LinkOut - more resources
Full Text Sources
Medical
Research Materials
Miscellaneous
