. 2010 Nov 19;285(47):36745-58.
doi: 10.1074/jbc.M110.124628. Epub 2010 Sep 17.

The loss of Cbl-phosphatidylinositol 3-kinase interaction perturbs RANKL-mediated signaling, inhibiting bone resorption and promoting osteoclast survival

Affiliations

The loss of Cbl-phosphatidylinositol 3-kinase interaction perturbs RANKL-mediated signaling, inhibiting bone resorption and promoting osteoclast survival

Naga Suresh Adapala et al. J Biol Chem. .

Abstract

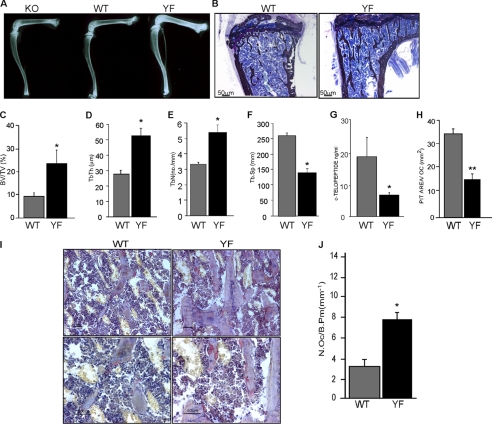
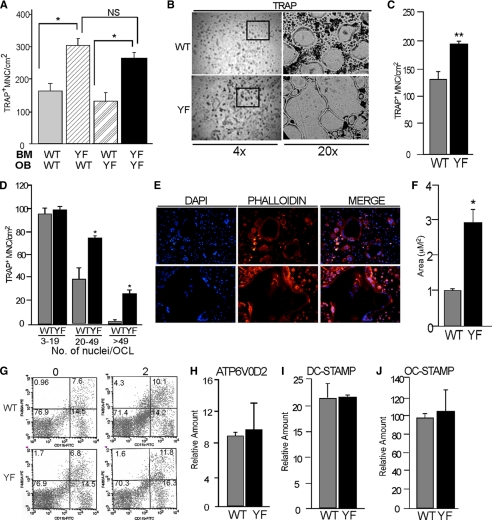
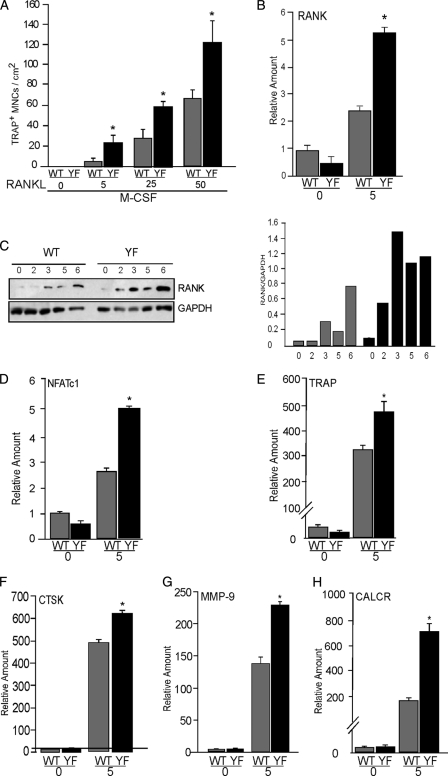
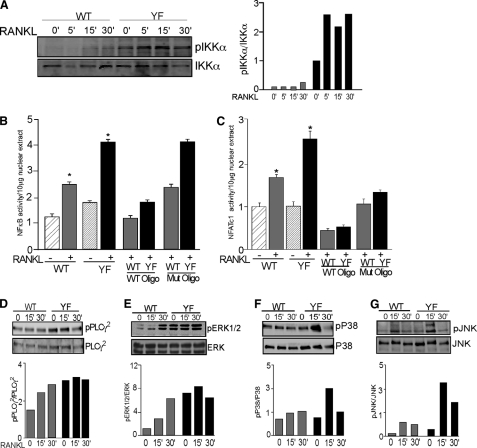
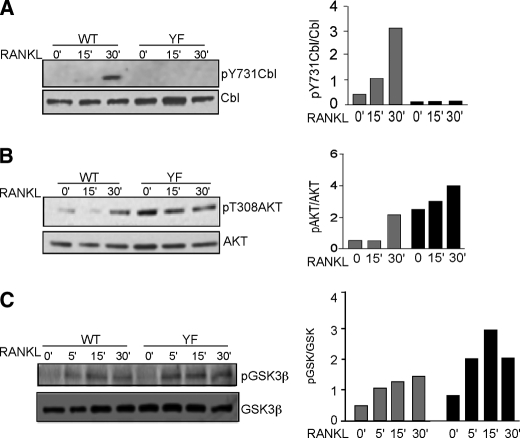
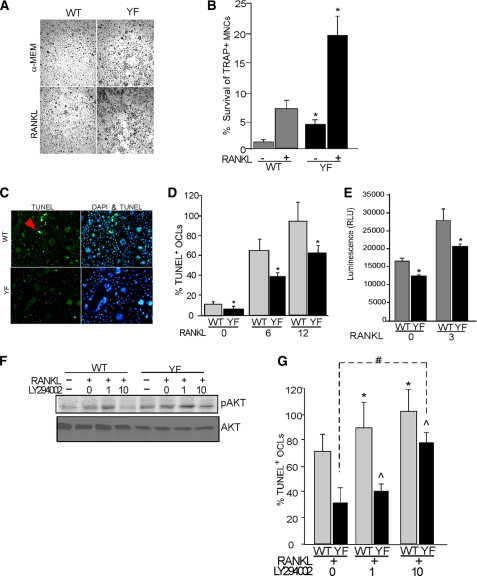
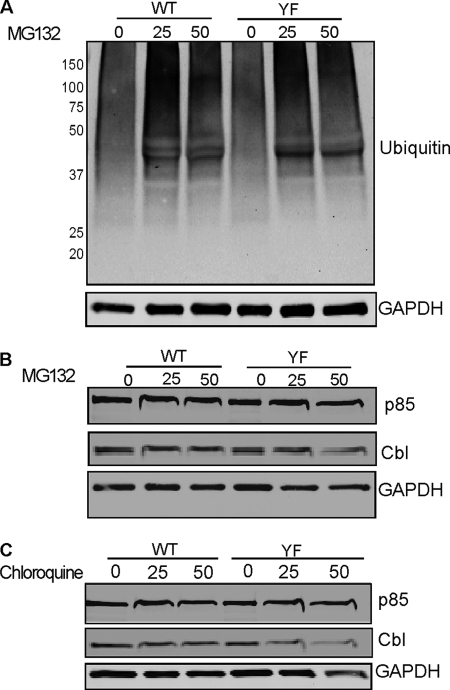
Cbl is an adaptor protein and an E3 ligase that plays both positive and negative roles in several signaling pathways that affect various cellular functions. Tyrosine 737 is unique to Cbl and is phosphorylated by Syk and Src family kinases. Phosphorylated Cbl Tyr(737) creates a binding site for the p85 regulatory subunit of PI3K, which also plays an important role in the regulation of bone resorption by osteoclasts. To investigate the role of Cbl-PI3K interaction in bone homeostasis, we examined the knock-in mice (Cbl(YF/YF)) in which the PI3K binding site in Cbl is ablated due to the mutation in the regulatory tyrosine. We report that in Cbl(YF/YF) mice, despite increased numbers of osteoclasts, bone volume is increased due to defective osteoclast function. Additionally, in ex vivo cultures, mature Cbl(YF/YF) osteoclasts showed an increased ability to survive in the presence of RANKL due to delayed onset of apoptosis. RANKL-mediated signaling is perturbed in Cbl(YF/YF) osteoclasts, and most interestingly, AKT phosphorylation is up-regulated, suggesting that the lack of PI3K sequestration by Cbl results in increased survival and decreased bone resorption. Cumulatively, these in vivo and in vitro results show that, on one hand, binding of Cbl to PI3K negatively regulates osteoclast differentiation, survival, and signaling events (e.g. AKT phosphorylation), whereas on the other hand it positively influences osteoclast function.


Figures

FIGURE 1.
FIGURE 1.
Abrogation of Cbl-PI3K interaction in mice results in increased bone volume due to decreased osteoclast activity. A, long bones from 12-week-old Cbl−/−, Cbl+/+, and CblYF/YF mice were subjected to x-ray to determine bone density. B, photomicrographs of the undecalcified section of tibiae from 6-week-old Cbl+/+ and CblYF/YF mice visualized at 4× magnification. Sections were stained with von Kossa and counterstained with toludine blue. C–F, histomorphometric analysis of cancellous region of the tibial metaphysis of 6-week-old WT and CblYF/YF mice. C, the bone volume in the metaphysis of the CblYF/YF mice was markedly increased. Histograms represent the bone volume expressed as the percentage of tissue volume (BV/TV). D, trabecular thickness (Tb.Th). E, trabecular number (Tb.N.). F, trabecular spacing (Tb.Sp). Data are presented as mean ± S.E. (error bars) (n = 5). *, p < 0.05 compared with the WT mice. G, measurement of serum collagen telopepetide demonstrated decreased OC activity in the CblYF/YF mice. H, pit formation activity of CblYF/YF OCLs was decreased. OCLs were generated by the co-culture method as described under “Experimental Procedures.” After removing adherent cells, the resorbed area on toluidine blue-stained dentine slices was quantified and normalized for the numbers of OCLs. Data are presented as mean ± S.E. (n = 9). **, p < 0.001 compared with the WT samples. I, histological analysis of 6-week-old WT and CblYF/YF bones. OCs were identified by a TRAP activity reaction product (red). Magnification was ×20 (upper panels) and ×40 (lower panels). J, histomorphometric analysis revealed increased numbers of OCs in CblYF/YF mice compared with WT mice.
FIGURE 2.
FIGURE 2.
Absence of Cbl-PI3K interaction results in increased osteoclast numbers due to cell-autonomous enhanced differentiation. A, co-culture of calvarial osteoblasts with bone marrow cells was performed to determine the cell-autonomous differentiation of the CblYF/YF precursors. After 7 days of culture, cultures were TRAP-stained, and OCLs with three or more nuclei were counted. CblYF/YF cultures had increased numbers of OCLs irrespective of the source of osteoblasts. B–E, non-adherent bone marrow precursor cells were cultured on plastic or glass coverslips in the presence of M-CSF for 2 days and for an additional 3 days in the presence of MCSF and RANKL. B, photomicrographs at the indicated magnifications of TRAP-stained OCLs at day 5. TRAP staining showed increased numbers and larger cells in CblYF/YF cultures. The black box (within the left panels at ×4 magnification) indicates the region at ×20 magnification. C, the numbers of TRAP+ multinucleated osteoclasts (MNC) in the CblYF/YF cultures (black bars) were significantly greater than in WT cultures (gray bars) at day 5. D, cells with more than 20–50 nuclei predominantly contributed to the increased numbers in CblYF/YF cultures. E, cells that were cultured on glass coverslips were stained for F-actin using rhodamine phalloidin (red) and DAPI (blue). Cells with more than 20 nuclei predominantly contributed to the increased numbers in CblYF/YF cultures. F, cell size was measured by using the analysis tool in Adobe Photoshop PS3 Extended Version. The size of OCLs in CblYF/YF cultures was 3-fold larger in CblYF/YF cultures. G, detection of CD11b- and CD4/80-positive bone marrow precursor cells using flow cytometry. Bone marrow cells were either untreated (day 0) or cultured in the presence of M-CSF for 2 days (day 2). The fraction of double-positive cells (percentage) is indicated. H–J, the expression of osteoclast fusion markers (ATP6V0D2 (H), DC-STAMP (I), and OC-STAMP (J)) was determined by quantitative real-time PCR. *, p < 0.05 as compared with WT control. Error bars, S.D.
FIGURE 3.
FIGURE 3.
Enhanced differentiation of CblYF/YF osteoclasts is due to hyperresponsiveness to RANKL. A, non-adherent bone marrow precursor cells were either untreated or cultured in the presence of M-CSF (20 μg/ml) and RANKL (μg/ml) at the indicated doses. After 5 days, cells were TRAP-stained, and OCLs with three or more nuclei were counted. B, bone marrow cells were either untreated (day 0) or cultured in the presence of MCSF (20 μg/ml) and RANKL (50 μg/ml) as described under “Experimental Procedures.” mRNA expression levels were measured by quantitative real-time PCR. C, total cell lysates were prepared at the indicated time points during the process of differentiation. The blot was probed using anti-RANK antibody (top). The blot was stripped and reprobed with GAPDH (bottom) to verify equal loading of protein. To correct for experimental variability, the amounts of total proteins in individual bands were quantified by using Odyssey Infrared Imaging Systems software 2.1 (LICOR Biosciences), and the ratio of RANK protein to GAPDH, a housekeeping protein, was calculated (gray bars, WT; black bars, CblYF/YF). D–F, bone marrow cells were differentiated in OCLs with M-CSF and RANKL. The expression of osteoclast differentiation markers on day 0 and 5 was determined by real-time PCR. D, NFATc1; E, TRAP; F, CTSK; G, MMP-9; H, CalcR. *, p < 0.05 as compared with WT control. Error bars, S.D.
FIGURE 4.
FIGURE 4.
RANK signaling is enhanced in CblYF/YF OCLs. A, OCLs were serum-starved for 1 h and then treated with RANKL (50 μg/ml) for the indicated times. Blots were probed with anti-phospho-IKKα antibodies (top). The blot was stripped and reprobed with total IKKα to demonstrate loading of proteins. The ratio of phosphorylated protein to total protein is represented in the graph (gray bars, WT; black bars, CblYF/YF). B, OCLs were treated with RANKL (50 μg/ml) for 6 h. A transcription assay was performed as described under “Experimental Procedures.” p65 transcription activity is expressed in relation to the untreated WT OCLs. Specificity of the assay was confirmed by competition of p65 activity with WT and mutant oligonucleotides. *, p < 0.05, as compared with WT control. C, OCLs were treated with RANKL as described above. ELISA-based transcription activity was determined by ELISA-based assay, as described under “Experimental Procedures.” NFATc1 transcription activity is expressed in relation to the untreated WT OCLs. Specificity of the assay was confirmed by competition with WT and mutant oligonucleotides. *, p < 0.05, as compared with WT untreated samples. D–G, OCLs were serum-starved for 30 min and treated with RANKL (50 μg/ml) for the indicated times. Cell lysates were processed for Western blot analysis. After blotting with the indicated phosphospecific antibodies (top panels), the blots were stripped and reprobed with antibodies to respective proteins to determine loading (bottom panels). To correct for experimental variability, the amounts of total proteins in individual bands were quantified by using Odyssey Infrared Imaging Systems software 2.1 (LICOR Biosciences), and the ratio of phosphorylated protein to total protein was calculated (gray bars, WT; black bars, CblYF/YF). A representative experiment of four repetitions is shown. Error bars, S.D.
FIGURE 5.
FIGURE 5.
AKT phosphorylation and activity is increased in CblYF/YF OCLs. A, OCLs were serum-starved for 30 min and treated with RANKL (50 μg/ml) for the indicated times. The blot was probed with anti-phospho-Cbl Tyr737 (pY737Cbl) antibodies to detect the phosphorylation of Cbl Tyr737 (top). The blot was stripped and reprobed with anti-Cbl antibodies to detect total Cbl levels in WT and CblYF/YF OCLs. The amounts of total proteins in individual bands were quantified as described above. B, OCLs were treated with RANKL as described above. Blots were probed with anti-phospho-AKT Thr308 (pAkt) (top) and anti-AKT antibodies (bottom). Quantification of blots was performed as above. C, phosphorylation of GSK is enhanced in CblYF/YF OCLs. OCLs were treated with RANKL as described above. Western blot was performed, and the blots were probed with anti-phospho-GSK and anti-GSK antibodies. Quantification of blots was performed as above.
FIGURE 6.
FIGURE 6.
CblYF/YF OCLs demonstrate enhanced survival as a result of increased PI3K activity. OCLs were either untreated or were treated with RANKL (50 μg/ml) for 48 h. After treatment, cells were fixed and TRAP-stained. A, photomicrographs of the TRAP-stained OC culture with the indicated treatment. Magnification was ×10. B, histogram represents the data expressed as a percentage of the initial number of TRAP + MNCs surviving after 48 h. (gray bars, WT; black bars, CblYF/YF). *, p < 0.05 as compared with WT control. C, to visualize apoptotic OCLs on day 5 of differentiation, OCLs were fixed and stained with DAPI and TUNEL. The arrows indicate bright green TUNEL-positive cells showing apoptotic nuclei. D, to determine onset of apoptosis after 5 days of culture, cells were either left untreated or treated with RANKL (50 μg/ml) for indicated times. TUNEL-positive cells were counted, and data are expressed as percentage of TUNEL-positive OCLs (gray bars, WT; black bars, CblYF/YF). *, p < 0.05 as compared with WT control. E, to determine the caspase-3 activity, OCLs were either left untreated or treated with RANKL (50 μg/ml) for 3 h. Caspase activity was measured as described under “Experimental Procedures” (gray bars, WT; black bars, CblYF/YF). F and G, to determine the role of AKT in the prolonged survival of CblYF/YF OCLs, cells were treated with RANKL (50 μg/ml) or were treated with increasing concentrations of PI3K inhibitor LY294002 (1–10 μm) for 12 h. F, blots were probed with anti-phospho-AKT Thr308 (top) and anti-AKT antibodies (bottom). G, cells were fixed, and the TUNEL assay was performed as described above, and data are expressed as percentage of TUNEL-positive OCLs. *, p value between 0 and 1 or 10 mm in WT; #, p value between 0 and 10 mm in CblYF/YF OCLs; ^, p value showing significance between WT and CblYF/YF OCLs in the presence of RANKL. Data are representative of three independent experiments. RLU, relative luminescence units; Error bars, S.D.
FIGURE 7.
FIGURE 7.
PI3K levels are not altered in CblYF/YF OCLs. A, OCLs were treated with proteasome inhibitor MG132 at the indicated concentrations for 6 h. After treatment, total cell lysate was prepared and processed for Western blotting. Blot was probed with anti-ubiquitin antibody (top), and the membrane was stripped and reprobed with anti-GAPDH antibodies to determine equal protein loading. B, blots were also probed with anti-p85 and anti-Cbl antibodies as indicated. The blot was stripped and reprobed with anti-GAPDH antibodies to demonstrate protein loading. C, OCLs were also treated with chloroquine for 1 h at the indicated concentrations to prevent lysosome-mediated protein degradation. Blots were probed with anti-p85 or anti Cbl antibodies. The blot was stripped and reprobed with anti-GAPDH to verify equal protein loading. A representative experiment of three repetitions is shown.

Similar articles

Cited by

References

    1. Teitelbaum S. L. (2000) Science 289, 1504–1508 - PubMed
    1. Horne W. C., Sanjay A., Bruzzaniti A., Baron R. (2005) Immunol. Rev. 208, 106–125 - PubMed
    1. Swaminathan G., Tsygankov A. Y. (2006) J. Cell. Physiol. 209, 21–43 - PubMed
    1. Andoniou C. E., Thien C. B., Langdon W. Y. (1996) Oncogene 12, 1981–1989 - PubMed
    1. Marengère L. E., Mirtsos C., Kozieradzki I., Veillette A., Mak T. W., Penninger J. M. (1997) J. Immunol. 159, 70–76 - PubMed

Publication types

MeSH terms