. 2010 Nov;9(11):1650-60.
doi: 10.1128/EC.00187-10. Epub 2010 Sep 17.

Characterization of glycoside hydrolase family 5 proteins in Schizosaccharomyces pombe

Affiliations

Characterization of glycoside hydrolase family 5 proteins in Schizosaccharomyces pombe

Encarnación Dueñas-Santero et al. Eukaryot Cell. 2010 Nov.

Abstract

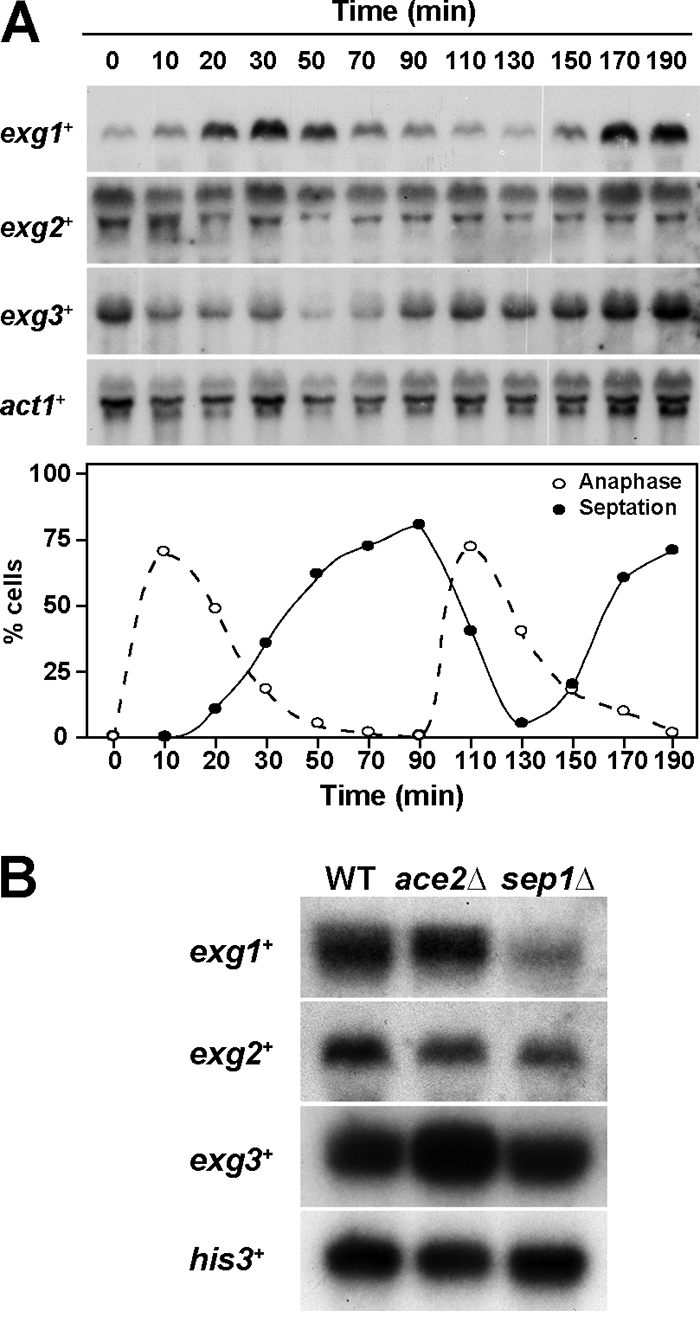
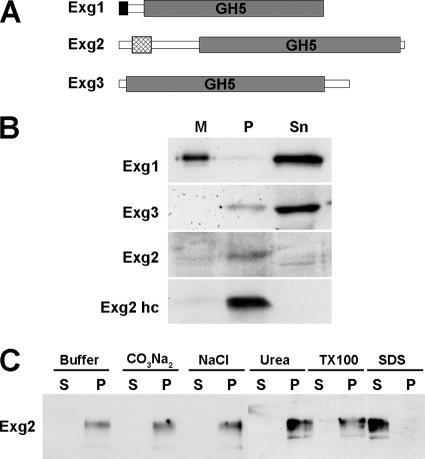
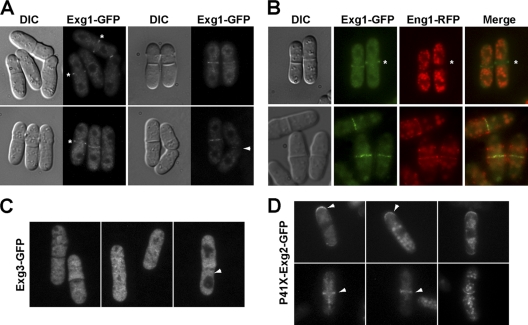
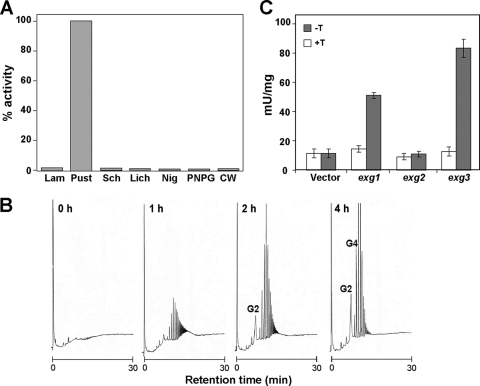
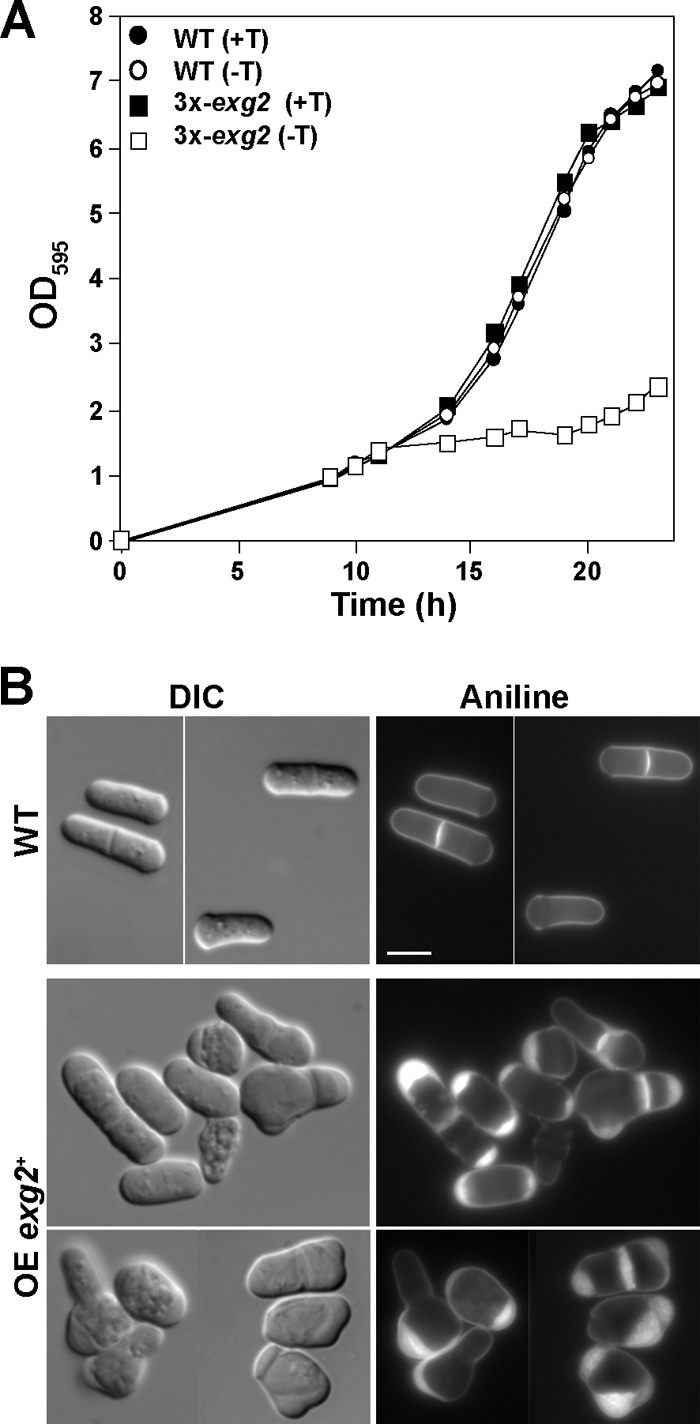
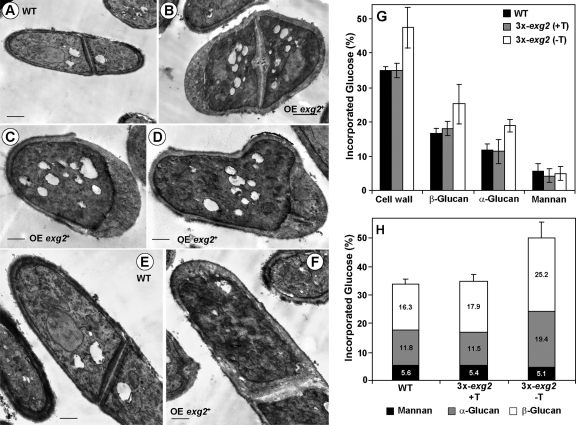
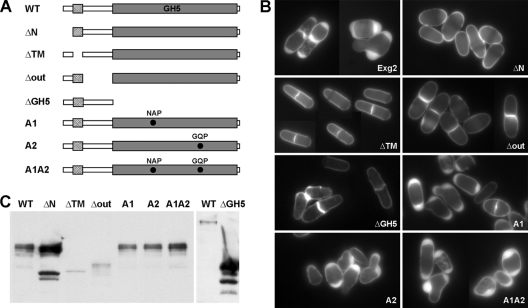
In yeast, enzymes with β-glucanase activity are thought to be necessary in morphogenetic events that require controlled hydrolysis of the cell wall. Comparison of the sequence of the Saccharomyces cerevisiae exo-β(1,3)-glucanase Exg1 with the Schizosaccharomyces pombe genome allowed the identification of three genes that were named exg1(+) (locus SPBC1105.05), exg2(+) (SPAC12B10.11), and exg3(+) (SPBC2D10.05). The three proteins have different localizations: Exg1 is secreted to the periplasmic space, Exg2 is a membrane protein, and Exg3 is a cytoplasmic protein. Characterization of the biochemical activity of the proteins indicated that Exg1 and Exg3 are active only against β(1,6)-glucans while no activity was detected for Exg2. Interestingly, Exg1 cleaves the glucans with an endohydrolytic mode of action. exg1(+) showed periodic expression during the cell cycle, with a maximum coinciding with the septation process, and its expression was dependent on the transcription factor Sep1. The Exg1 protein localizes to the septum region in a pattern that was different from that of the endo-β(1,3)-glucanase Eng1. Overexpression of Exg2 resulted in an increase in cell wall material at the poles and in the septum, but the putative catalytic activity of the protein was not required for this effect.


Figures

Fig. 1.
Fig. 1.
Transcription pattern of exg genes. (A) Expression during the cell cycle. Synchrony was induced by arrest-release of a cdc25-22 mutant, and samples were taken at the indicated time points after the release for RNA extraction. RNA was hybridized with specific probes for exg1+, exg2+, exg3+, or act1+. The graph represents the anaphase index or septation index at each time point. In this experiment, the peak of septum formation occurred at 70 to 90 min. (B) Dependence on the Ace2 and Sep1 transcription factors. RNA from wild-type, ace2Δ, and sep1Δ mutants was extracted, transferred to nitrocellulose membranes, and probed with a specific probes for exg1+, exg2+, or exg3+ or his3+ as a control.
Fig. 2.
Fig. 2.
Cellular fractionation of the Exg proteins. (A) Schematic representation of the characteristics of the Exg1, Exg2, and Exg3 proteins. The GH5 domain, common to the three proteins, is indicated. The black box represents a hydrophobic region with the characteristics of the signal secretion peptides, and the hatched box represents a putative transmembrane domain. (B) Cells expressing Exg1-HA, Exg2-HA, or Exg3-HA were grown in minimal medium to late log phase (OD595 of 1.5). Those carrying Exg2-myc under the control of the nmt1 promoter (Exg2 hc) were grown in the absence of thiamine for 22 h. Cells were collected by centrifugation and broken with glass beads. Extracts were centrifuged at 10,000 rpm for 10 min to separate the cell wall and membranes (pellet [P]) from the cytoplasmic content (supernatant [Sn]). Concentrated culture medium (M) was also loaded in the gels. Proteins were fractionated using SDS-PAGE gels and immunoblotted using antibodies against the HA or c-myc epitopes. (C) Cells carrying Exg2-myc under the control of the P3Xnmt1 promoter were extracted after lysis in buffer containing 0.6 M NaCl, 0.1 M Na2CO3, 1.6 M urea, 4% Triton X-100, and 2% SDS. Soluble and insoluble proteins were separated by centrifugation at 13 000 × g for 30 min, as indicated by supernatant (S) and pellet (P), respectively.
Fig. 3.
Fig. 3.
Localization of Exg proteins. (A) Wild-type cells expressing exg1-GFP were grown to early log phase. Photographs of differential interference contrast microscopy (DIC) or Exg1-GFP are shown. (B) Exponentially growing wild-type cells expressing Exg1-GFP and Eng1-RFP were imaged for DIC, RFP, and GFP fluorescence. Overlay of the red and green channels is also shown in the merged images. (C) Wild-type cells expressing exg3-GFP were grown to early log phase, and live cells were used for microscopic observation. (D) Wild-type cells expressing exg2-GFP under the control of the P41X-nmt1 promoter were grown in medium without thiamine for 18 h, and live cells were used for microscopic observation. Representative cells at different stages of the cell cycle are shown.
Fig. 4.
Fig. 4.
Exg proteins have activity against β(1,6)-glucans. (A) β-Glucanase activity of purified Exg1 against laminarin [β(1,3)-glucan], pustulan [β(1,6)-glucan], schleroglucan [β(1,3)-glucan with β(1,6) ramifications], lichenan [β(1,3)-(1,4)-glucan], nigeran [α(1,3)-glucan], pNPG, or S. pombe cell wall (CW). Five micrograms of protein was incubated with the substrates for 24 h before the concentration of reducing sugars released was assayed. Activity is shown as a percentage of the maximum activity detected for pustulan. (B) HPAE-PED chromatographic analysis of oligosaccharides released by Exg1. The reaction was conducted in acetate buffer at 37°C using soluble pustulan as a substrate for the indicated times (h) before the products were analyzed by HPAE-PED chromatography. G2, gentobiose, G4, gentotetraose. (C) Enzymatic activity against pustulan [β(1,6)-glucan] of cells overexpressing exg1+, exg2+, or exg3+. Wild-type cells transformed with plasmids pED138 (carrying P3Xnmt1-exg1), pML2 (P3Xnmt1-exg2), pED139 (P3Xnmt1-exg3), or vector alone (pJCR-3XL) were grown for 22 h in the presence (white bars) or absence (black bars) of thiamine (T) to induce the expression of the genes. Cell extracts were prepared and incubated in the presence of pustulan for different amounts of time. Activity is presented as mU/mg. The result is the mean of two independent assays. Error bars indicate the standard deviation.
Fig. 5.
Fig. 5.
Overexpression of exg2+ produces severe defects in cell growth. (A) Growth of wild-type (WT) strains carrying P3Xnmt1-exg2 (3X-exg2) or vector alone grown in the presence (+) or absence (−) of thiamine (T). Cells overexpressing exg2+ cease growth after 10 to 12 h of induction. (B) Microscopic appearance of wild-type and cells overexpressing exg2+ (OE exg2+). Cells that had been growing in the absence of thiamine for 22 h were stained with aniline blue, a fluorochrome that preferentially binds β(1,3)-glucans. Photographs of DIC microscopy or aniline blue-stained cells are shown. Bar, 5 μm.
Fig. 6.
Fig. 6.
Effects of exg2+ overexpression. Wild-type (WT) cells containing vector or plasmid pML2 (overexpressing [OE] exg2+), as indicated, were grown for 22 h in the absence of thiamine and prepared for transmission electron microscopy. Images of panels A to D show a general view of the cells, while panels E and F show details of the septa. Bars, 0.6 μm (C to E) and 1.1 μm (A and B). (G and H) Composition of the cell wall in strains overexpressing exg2+. The relative levels of [14C]glucose radioactivity incorporated into each cell wall polysaccharide in a 4-h labeling are shown for the wild-type strain (h20) containing vector (pJCR-3XL) or plasmid pML2 grown in the presence (+T) or absence (−T) of thiamine. Values are the means of three independent experiments with duplicate samples. Standard deviations are shown.
Fig. 7.
Fig. 7.
Overexpression of mutant forms of exg2+. (A) Schematic representation of Exg2 and different mutant versions generated. The gray box represents the GH5 domain, and the hatched box represents the putative transmembrane domain. The different constructs were cloned under the control of the nmt1 promoter and contained the c-myc epitope at the C terminus. (B) Representative images of cells carrying Exg2 (pED172), Exg2-ΔN (pED178), Exg2-ΔTM (pED179), Exg2-Δout (pED177), Exg2-A1 (pED188), Exg2-A2 (pED193), Exg2-A1A2 (pED195), and Exg2-ΔGH5 (pED215) grown for 22 h in the absence of thiamine. Cells were stained with aniline blue. (C) Exg2 protein levels. Protein extracts from the same strains were prepared, separated by SDS-PAGE (12% for Exg2-ΔGH5 and 8% for the other constructs), transferred to nitrocellulose membranes, and probed with anti-myc antibodies.

Similar articles

Cited by

References

    1. Adams D. J. 2004. Fungal cell wall chitinases and glucanases. Microbiology 150:2029–2035 - PubMed
    1. Alonso-Núñez M., An H., Martín-Cuadrado A. B., Mehta S., Petit C., Sipiczki M., del Rey F., Gould K., Vázquez de Aldana C. R. 2005. Ace2p controls the expression of genes required for cell separation in Schizosaccharomyces pombe. Mol. Biol. Cell 16:2003–2017 - PMC - PubMed
    1. Arellano M., Duran A., Perez P. 1997. Localisation of the Schizosaccharomyces pombe rho1p GTPase and its involvement in the organisation of the actin cytoskeleton. J. Cell Sci. 110:2547–2555 - PubMed
    1. Bähler J., Wu J. Q., Longtine M. S., Shah N. G., McKenzie A., Steever A. B., Wach A., Philippsen P., Pringle J. R. 1998. Heterologous modules for efficient and versatile PCR-based gene targeting in Schizosaccharomyces pombe. Yeast 14:943–951 - PubMed
    1. Baladrón V., Ufano S., Dueñas E., Martín-Cuadrado A. B., del Rey F., Vázquez de Aldana C. R. 2002. Eng1p, an endo-1,3-β-glucanase localized at the daughter side of the septum, is involved in cell separation in Saccharomyces cerevisiae. Eukaryot. Cell 1:774–786 - PMC - PubMed

Publication types

MeSH terms