. 2010 Dec;59(12):3117-26.
doi: 10.2337/db09-1805. Epub 2010 Sep 17.

Deletion of Pten in pancreatic ß-cells protects against deficient ß-cell mass and function in mouse models of type 2 diabetes

Affiliations

Deletion of Pten in pancreatic ß-cells protects against deficient ß-cell mass and function in mouse models of type 2 diabetes

Linyuan Wang et al. Diabetes. 2010 Dec.

Abstract

Objective: Type 2 diabetes is characterized by diminished pancreatic β-cell mass and function. Insulin signaling within the β-cells has been shown to play a critical role in maintaining the essential function of the β-cells. Under basal conditions, enhanced insulin-PI3K signaling via deletion of phosphatase with tensin homology (PTEN), a negative regulator of this pathway, leads to increased β-cell mass and function. In this study, we investigated the effects of prolonged β-cell-specific PTEN deletion in models of type 2 diabetes.

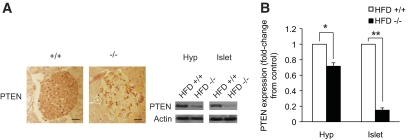
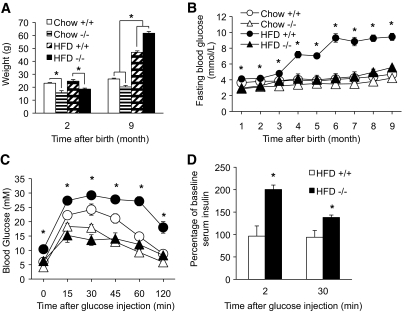
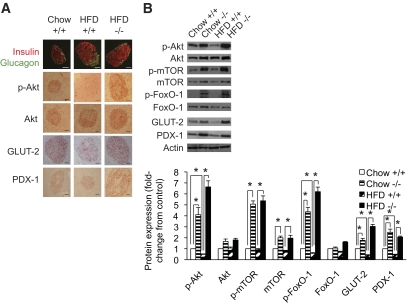
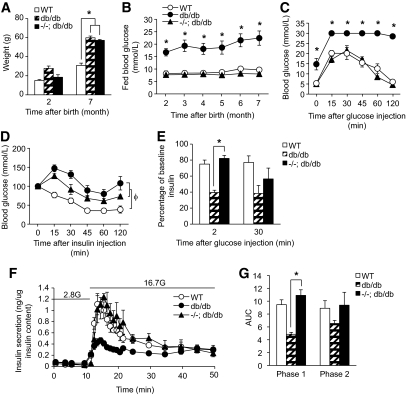
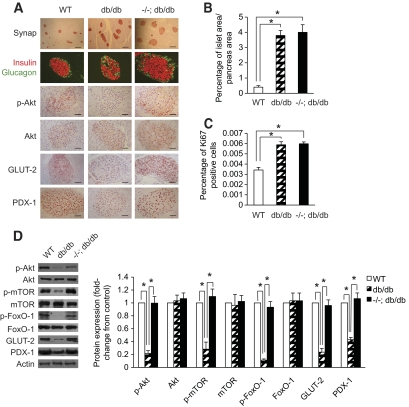
Research design and methods: Two models of type 2 diabetes were employed: a high-fat diet (HFD) model and a db/db model that harbors a global leptin-signaling defect. A Cre-loxP system driven by the rat insulin promoter (RIP) was employed to obtain mice with β-cell-specific PTEN deletion (RIPcre(+) Pten(fl/fl)).

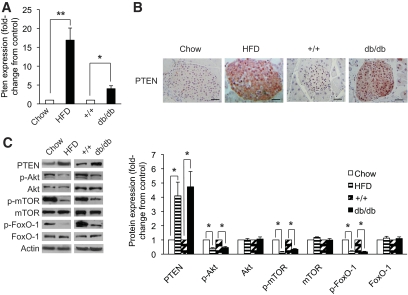
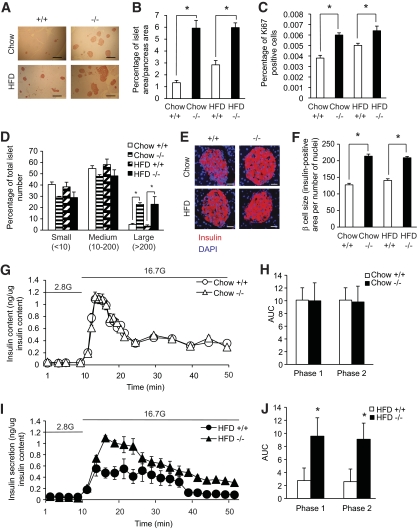
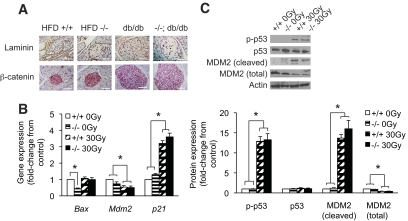
Results: PTEN expression in islets was upregulated in both models of type 2 diabetes. RIPcre(+) Pten(fl/fl) mice were completely protected against diabetes in both models of type 2 diabetes. The islets of RIPcre(+) Pten(fl/fl) mice already exhibited increased β-cell mass under basal conditions, and there was no further increase under diabetic conditions. Their β-cell function and islet PI3K signaling remained intact, in contrast to HFD-fed wild-type and db/db islets that exhibited diminished β-cell function and attenuated PI3K signaling. These protective effects in β-cells occurred in the absence of compromised response to DNA-damaging stimuli.

Conclusions: PTEN exerts a critical negative effect on both β-cell mass and function. Thus PTEN inhibition in β-cells can be a novel therapeutic intervention to prevent the decline of β-cell mass and function in type 2 diabetes.


Figures

FIG. 1.
FIG. 1.
Islet PTEN upregulation with concomitant attenuation of PI3K signaling in models of type 2 diabetes. A and B: PTEN transcript levels by quantitative PCR (A) and immunohistochemical staining (B) of chow- and HFD-fed (after 7 months on HFD); wild-type (+/+) and db/db islets (7 months of age) (n = 3). C: Western blot (left panel) and quantification (right panel) of PTEN, p-Akt (Ser473), total Akt, p-mTOR (Ser2448), total mTOR, p-FoxO-1 (Ser253) and total FoxO-1 in chow- and HFD-fed (7 months on HFD); wild-type and db/db islets (7 months of age) (n = 3). *P < 0.05; **P < 0.005. Scale bar, 50 μm. The results are presented as mean ± SE. (A high-quality digital representation of this figure is available in the online issue.)
FIG. 2.
FIG. 2.
PTEN deletion in RIPcre+ Ptenfl/fl islets. A: Immunohistochemical staining of PTEN in RIPcre+ Pten+/+ (+/+) and RIPcre+ Ptenfl/fl (−/−) pancreas sections. B: Western blot (left panel) and quantification (right panel) of PTEN expression in RIPcre+ Ptenfl/fl islets and hypothalamus (Hyp) (n = 3). *P < 0.05; **P < 0.005. Scale bar, 50 μm. The results are presented as mean ± SE. (A high-quality digital representation of this figure is available in the online issue.)
FIG. 3.
FIG. 3.
RIPcre+ Ptenfl/fl mice showed maintained glucose metabolism and in vivo glucose stimulated insulin secretion after prolonged HFD while demonstrating drastic weight gain. A: Weight of RIPcre+ Pten+/+ (+/+) and RIPcre+ Ptenfl/fl (−/−) mice at the start of HFD (2 months of age) and after HFD (9 months of age) with chow-fed RIPcre+ Pten+/+ and RIPcre+ Ptenfl/fl mice at the same time points. B: Fasting blood glucose of RIPcre+ Pten+/+ and RIPcre+ Ptenfl/fl mice fed either chow or HFD for 7 months (n >7). C: Glucose tolerance tests of RIPcre+ Pten+/+ and RIPcre+ Ptenfl/fl mice after 7 months of either chow or HFD feeding (n >7). D: in vivo glucose stimulated insulin secretions of RIPcre+ Pten+/+ and RIPcre+ Ptenfl/fl mice after 7 months of either chow or HFD feeding (n >3). *P < 0.05. The results are presented as mean ± SE.
FIG. 4.
FIG. 4.
RIPcre+ Ptenfl/fl mice maintained high islet mass and β-cell size with protection against HFD-induced β-cell dysfunction. A and B: Insulin staining (A) and quantification (B) of pancreas sections of RIPcre+ Pten+/+ (+/+) and RIPcre+ Ptenfl/fl (−/−) mice fed either chow or HFD (n = 3), Scale bar, 500 μm. C: Percentage of Ki67 positive cells in islets from RIPcre+ Pten+/+ and RIPcre+ Ptenfl/fl mice fed either chow or HFD (n = 3). D: proportion of small (<10 cells), medium (10–200 cells) and large (>200 cells) islet in pancreas from RIPcre+ Pten+/+ and RIPcre+ Ptenfl/fl mice fed either chow or HFD (n = 3). E and F: Immunofluorescent staining of insulin/DAPI (E) and quantification of β-cell size (F) of pancreas from RIPcre+ Pten+/+ and RIPcre+ Ptenfl/fl mice fed either chow or HFD (n = 3), Scale bar, 50 μm. G and H: Insulin secretion per 60 islets during perifusion analysis (G) and quantification of area under the curve (AUC) (H) of chow-fed RIPcre+ Pten+/+ and RIPcre+ Ptenfl/fl islets (n = 3). I and J: Insulin secretion per 60 islets during perifusion analysis (I) and quantification of area under the curve (J) of HFD-fed RIPcre+ Pten+/+ and RIPcre+ Ptenfl/fl islets (n = 3). *P < 0.05. Results are presented as mean ± SE. (A high-quality digital representation of this figure is available in the online issue.)
FIG. 5.
FIG. 5.
RIPcre+ Ptenfl/fl mice maintained islet PI3K signaling after prolonged HFD. A: Immunofluorescent staining of insulin/glucagon, and immunohistochemical staining of p-Akt (Ser473), total Akt, GLUT2, and PDX-1 in chow-fed, HFD-fed RIPcre+ Pten+/+ (+/+) and HFD-fed RIPcre+ Ptenfl/fl (−/−) mice. B: Western blot (left panel) and quantification (right panel) of p-Akt (Ser473), total Akt, p-mTOR (Ser2448), total mTOR, p-FoxO-1 (Ser253), total FoxO-1, GLUT-2, and PDX-1 of islets from RIPcre+ Pten+/+ and RIPcre+ Ptenfl/fl mice fed either chow or HFD (n = 3). *P < 0.05. Scale bar, 50 μm. Results are presented as mean ± SE. (A high-quality digital representation of this figure is available in the online issue.)
FIG. 6.
FIG. 6.
RIPcre+ Ptenfl/fl Leprdb/db mice exhibited comparable weight gain and normal glucose tolerance despite being insulin resistant with normal β-cell function. A: Weight of wild-type (WT), RIPcre+ Pten+/+ Leprdb/db (db/db), and RIPcre+ Ptenfl/fl Leprdb/db (−/−; db/db) mice at 2 and 7 months of age (n >7). B: Fed blood glucose of wild-type, RIPcre+ Pten+/+ Leprdb/db, and RIPcre+ Ptenfl/fl Leprdb/db mice from 2 to 7 months of age (n >7). C: Glucose tolerance test of wild-type, RIPcre+ Pten+/+ Leprdb/db, and RIPcre+ Ptenfl/fl Leprdb/db mice at 7 months of age (n >7). D: Insulin tolerance test of wild-type, RIPcre+ Pten+/+ Leprdb/db, and RIPcre+ Ptenfl/fl Leprdb/db mice at 7 months of age (n >7). E: In vivo glucose-stimulated insulin secretion of wild-type, RIPcre+ Pten+/+ Leprdb/db, and RIPcre+ Ptenfl/fl Leprdb/db mice at 7 months of age (n = 3). F and G: Insulin secretion per 60 islets during perifusion analysis (F) and quantification of area under the curve (G) of wild-type, RIPcre+ Pten+/+ Leprdb/db, and RIPcre+ Ptenfl/fl Leprdb/db mice (n = 3). *P < 0.05 for RIPcre+ Ptenfl/fl Leprdb/db mice compared with RIPcre+ Pten+/+ Leprdb/db mice or as indicated; φP < 0.05 for both RIPcre+ Pten+/+ Leprdb/db and RIPcre+ Ptenfl/fl Leprdb/db mice compared with wild-type mice. Results are presented as mean ± SE.
FIG. 7.
FIG. 7.
RIPcre+ Ptenfl/fl Leprdb/db mice exhibit islet hypertrophy with normal islet architecture and enhanced PI3K signaling. A: Immunofluorescent staining of insulin/glucagon, and immunohistochemical staining of synaptophysin, p-Akt (Ser473), total Akt, GLUT2, and PDX-1 in wild-type (WT), RIPcre+ Pten+/+ Leprdb/db (db/db), and RIPcre+ Ptenfl/fl Leprdb/db (−/−; db/db) mice at 7 months of age. B: Quantification of islet area in wild type, RIPcre+ Pten+/+ Leprdb/db, and RIPcre+ Ptenfl/fl Leprdb/db at 7 months of age (n = 4). C: Percentage of Ki67 positive cells in wild-type, RIPcre+ Pten+/+ Leprdb/db, and RIPcre+ Ptenfl/fl Leprdb/db mice at 7 months of age (n = 4). D: Western blot (left panel) and quantification (right panel) of p-Akt (Ser473), total Akt, p-mTOR (Ser2448), total mTOR, p-FoxO-1 (Ser253), total FoxO-1, GLUT-2, and PDX-1 of islets from wild-type, RIPcre+ Pten+/+ Leprdb/db, and RIPcre+ Ptenfl/fl Leprdb/db mice at 7 months of age (n = 3). *P < 0.05. Scale bar, 500 μm (A, top panel); 50 μm (A, rows 2 to 6). Results are presented as mean ± SE. (A high-quality digital representation of this figure is available in the online issue.)
FIG. 8.
FIG. 8.
HFD-fed RIPcre+ Ptenfl/fl and RIPcre+ Ptenfl/fl Leprdb/db mice showed intact islet integrity and uncompromised response to gamma irradiation. A: Laminin and β-catenin staining demonstrated intact basement membrane and cell-to-cell adhesion in HFD-fed (9 months of age) RIPcre+ Ptenfl/fl (−/−) and RIPcre+ Ptenfl/fl Leprdb/db (−/−; db/db) (9 months of age) mice. B: Transcripts levels of p53-related gene including Bax, Mdm2, and p21 during quantitative PCR of RIPcre+ Pten+/+ (+/+) and RIPcre+ Ptenfl/fl islets with or without 30Gy gamma irradiation (n = 2). C: Western blotting (left panel) and quantification (right panel) of p-p53 (Ser392), total p53, cleaved MDM2, and total MDM2 in RIPcre+ Pten+/+ and RIPcre+ Ptenfl/fl islets with or without 30Gy gamma irradiation (n = 2). *P < 0.05. Scale bar, 50 μm. Results are presented as mean ± SE. (A high-quality digital representation of this figure is available in the online issue.)

Similar articles

Cited by

References

    1. Robinson KA, Buse MG: Mechanisms of high-glucose/insulin-mediated desensitization of acute insulin-stimulated glucose transport and Akt activation. Am J Physiol Endocrinol Metab 2008;294:E870–E881 - PMC - PubMed
    1. Marchetti P, Del Guerra S, Marselli L, Lupi R, Masini M, Pollera M, Bugliani M, Boggi U, Vistoli F, Mosca F, Del Prato S: Pancreatic islets from type 2 diabetic patients have functional defects and increased apoptosis that are ameliorated by metformin. J Clin Endocrinol Metab 2004;89:5535–5541 - PubMed
    1. Mitrakou A, Kelley D, Mokan M, Veneman T, Pangburn T, Reilly J, Gerich J: Role of reduced suppression of glucose production and diminished early insulin release in impaired glucose tolerance. N Engl J Med 1992;326:22–29 - PubMed
    1. Porte D, Jr, Kahn SE: β-cell dysfunction and failure in type 2 diabetes: potential mechanisms. Diabetes 2001;1(Suppl.):S160–S163 - PubMed
    1. Kahn SE: β cell failure: causes and consequences. Int J Clin Pract 2001;September:13–18 - PubMed

Publication types

MeSH terms