. 2010 Dec;59(12):3208-15.
doi: 10.2337/db10-0552. Epub 2010 Sep 17.

Candesartan attenuates diabetic retinal vascular pathology by restoring glyoxalase-I function

Affiliations

Candesartan attenuates diabetic retinal vascular pathology by restoring glyoxalase-I function

Antonia G Miller et al. Diabetes. 2010 Dec.

Abstract

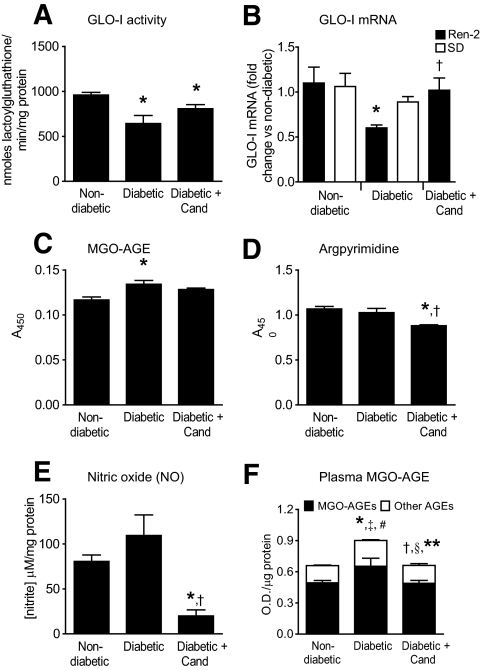
Objective: Advanced glycation end products (AGEs) and the renin-angiotensin system (RAS) are both implicated in the development of diabetic retinopathy. How these pathways interact to promote retinal vasculopathy is not fully understood. Glyoxalase-I (GLO-I) is an enzyme critical for the detoxification of AGEs and retinal vascular cell survival. We hypothesized that, in retina, angiotensin II (Ang II) downregulates GLO-I, which leads to an increase in methylglyoxal-AGE formation. The angiotensin type 1 receptor blocker, candesartan, rectifies this imbalance and protects against retinal vasculopathy.

Research design and methods: Cultured bovine retinal endothelial cells (BREC) and bovine retinal pericytes (BRP) were incubated with Ang II (100 nmol/l) or Ang II+candesartan (1 μmol/l). Transgenic Ren-2 rats that overexpress the RAS were randomized to be nondiabetic, diabetic, or diabetic+candesartan (5 mg/kg/day) and studied over 20 weeks. Comparisons were made with diabetic Sprague-Dawley rats.

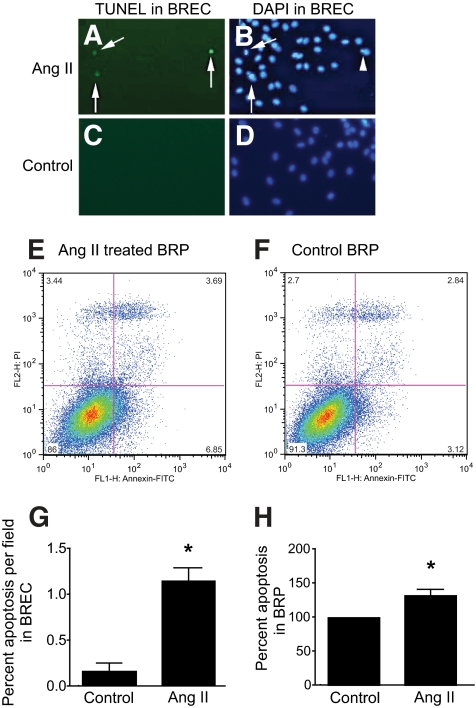
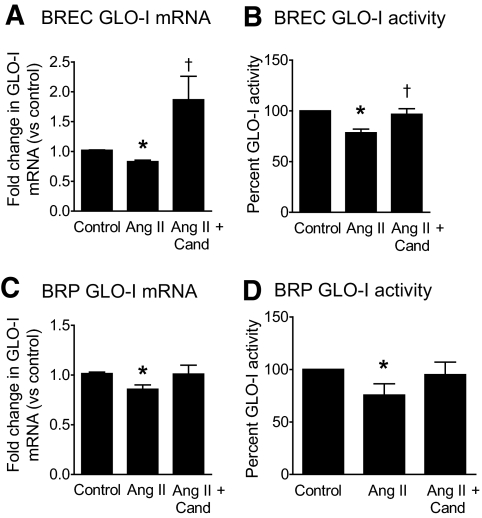
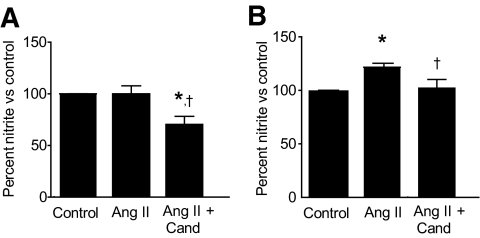
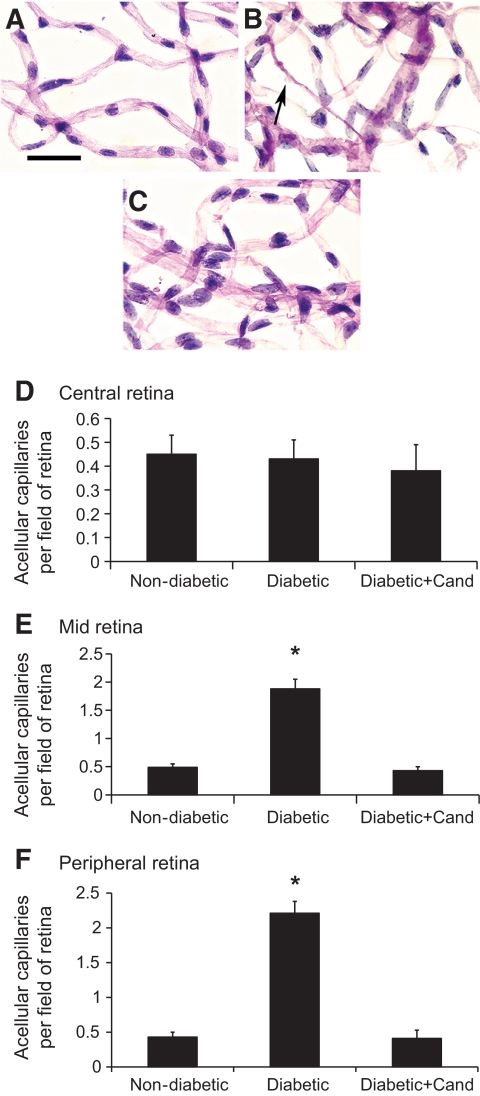
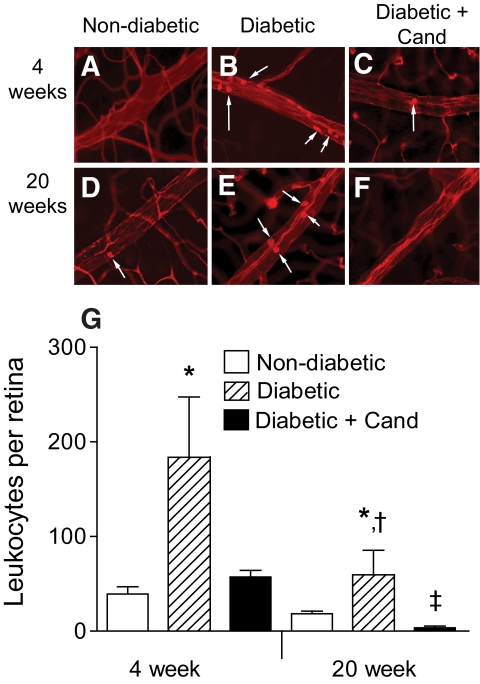
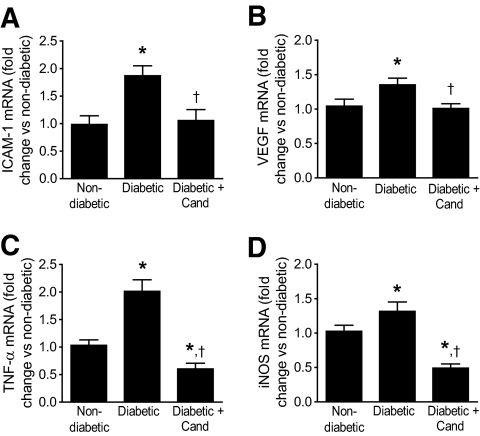
Results: In BREC and BRP, Ang II induced apoptosis and reduced GLO-I activity and mRNA, with a concomitant increase in nitric oxide (NO(•)), the latter being a known negative regulator of GLO-I in BRP. In BREC and BRP, candesartan restored GLO-I and reduced NO(•). Similar events occurred in vivo, with the elevated RAS of the diabetic Ren-2 rat, but not the diabetic Sprague-Dawley rat, reducing retinal GLO-I. In diabetic Ren-2 rats, candesartan reduced retinal acellular capillaries, inflammation, and inducible nitric oxide synthase and NO(•), and restored GLO-I.

Conclusions: We have identified a novel mechanism by which candesartan improves diabetic retinopathy through the restoration of GLO-I.


Figures

FIG. 1.
FIG. 1.
BREC and BRP apoptosis as detected by TUNEL staining and flow cytometry, respectively, after treatment with Ang II. In BREC, TUNEL staining is increased after treatment with 100 nmol/l Ang II for 24 h (A) compared with control (C). DAPI nuclear staining of Ang II-treated (B) and control (D) BREC. Arrows denote TUNEL-positive BREC, and arrowhead denotes cellular blebbing, a common feature of apoptosis. Magnification ×200. Representative example of Annexin V-FITC (x-axis) and propidium iodide (PI) staining (y-axis) to detect apoptotic cells after treatment of BRP with 100 nmol/l Ang II (E) or control (F) for 24 h. Increases were observed in the Annexin V positive, or early apoptotic phase (bottom right-hand quadrant), and Annexin V positive/PI positive (top right-hand quadrant), or late apoptotic phase (E). Bottom left quadrant, viable cells; Top left quadrant, necrotic cells (PI staining only). G: Graphical representation of BREC apoptosis detected by TUNEL staining; *P < 0.01 versus control. N = 3 samples and is a representative dataset of three independent experiments. H: Graphical representation of BRP apoptosis detected by Annexin/PI staining; *P < 0.03 versus control. All data were analyzed by unpaired t tests. N = 3 independent experiments. Values are mean ± SEM. (A high-quality color representation of this figure is available in the online issue.)
FIG. 2.
FIG. 2.
GLO-I mRNA and activity levels in BREC and BRP after treatment with Ang II and candesartan (Cand). In BREC (A and B) and BRP (C and D), GLO-I mRNA (A and C) and activity (B and D) is decreased after treatment with Ang II (100 nmol/l) for 24 h compared with control. Cand (1 μmol/l) restored GLO-I activity and mRNA in BREC and BRP co-incubated with Ang II. A, B: *P < 0.05 versus control, †P < 0.05 versus Ang II. C and D: *P < 0.03 versus control. All data were analyzed by Kruskal-Wallis test, followed by Mann-Whitney U tests. Values are the mean of N = 3–4 independent experiments with triplicate samples within each experiment.
FIG. 3.
FIG. 3.
NO levels in BREC (A) and BRP (B) after treatment with Ang II and Cand for 24 h. A: Treatment of BREC with 100 nmol/l Ang II had no effect on NO levels. In BREC treated with Ang II+Cand (1 μmol/l), NO levels were reduced below both control and Ang II treated cells. *P < 0.01 versus control, †P < 0.03 versus Ang II. B: Treatment of BRP with 100 nmol/l Ang II significantly increased NO levels. In BRP treated with Ang II+Cand, NO levels were reduced to control levels. *P < 0.05 versus control, †P < 0.05 versus Ang II. BRP were analyzed by one-way ANOVA, followed by Bonferroni post hoc tests. BREC were analyzed by Kruskal-Wallis tests followed by Mann-Whitney U tests. Values are the means of 3 and 7 independent experiments (BRP and BREC, respectively) with triplicate samples within each experiment.
FIG. 4.
FIG. 4.
Acellular capillaries in trypsin digests of retina in representative micrographs from Ren-2 rats after 20 weeks of diabetes. Retina stained with Periodic-acid Schiff's reagent. Scale bar = 20 μm. Nondiabetic (A), diabetic (B), and diabetic+Cand (5 mg/kg/day) (C). In diabetic Ren-2 rats, acellular capillaries were increased in the mid and peripheral retina compared with nondiabetic Ren-2 rats. In diabetic Ren-2 rats, Cand reduced acellular capillaries in the mid and peripheral retina to the level of nondiabetic control. Arrow denotes acellular capillary with pericyte ghost at arrowhead tip. Graphs showing number of acellular capillaries per retinal field (mean ± SEM) in the central (D), mid (E), and peripheral (F) retina. *P < 0.05 versus nondiabetic, diabetic+Cand. N = 8 animals/group. Data were analyzed by one-way ANOVA, followed by Bonferroni post hoc tests. (A high-quality color representation of this figure is available in the online issue.)
FIG. 5.
FIG. 5.
Leukocyte adherence in retinal blood vessels in representative micrographs of Ren-2 rats after 4 and 20 weeks of diabetes after perfusion with rhodamine coupled to Concanavalin A. Scale bar = 80 μm. Arrows denote adherent leukocytes. Leukocytes were counted in all retinal vessels. Four-week study: Nondiabetic (A), diabetic (B), and diabetic+Cand (C). Twenty-week study: Nondiabetic (D), diabetic (E), and diabetic+Cand (F). Diabetes at both 4 and 20 weeks is associated with an increase in leukocyte adherence in retinal vessels compared with age-matched nondiabetic control. In diabetic Ren-2 rats, Cand reduced leukocyte adherence in retinal vessels to the level of nondiabetic control. G: Graphical representation of leukocyte adherence in vessels of the retina (mean ± SEM). N = 6–10 animals/group. *P < 0.03 versus age-matched nondiabetic control and diabetic+Cand; †P < 0.02 versus week 4 diabetic; ‡P < 0.005 versus age-matched nondiabetic control. BREC were analyzed by Kruskal-Wallis tests followed by Mann-Whitney U tests. (A high-quality color representation of this figure is available in the online issue.)
FIG. 6.
FIG. 6.
ICAM-1 (A), VEGF (B), TNF-α (C), and iNOS (D) mRNA levels in retina of Ren-2 rats after 4 weeks of diabetes. Retinal ICAM-1, VEGF, TNF-α, and iNOS mRNA levels are increased in diabetic Ren-2 rats compared with nondiabetic control. In diabetic Ren-2 rats, Cand reduced both retinal ICAM-1 (A) and VEGF mRNA (B) to the level of nondiabetic controls, with TNF-α (C) and iNOS mRNA (D) decreasing to below control levels. For panels A, B, and D, data were analyzed by one-way ANOVA, followed by Bonferroni post hoc tests. *P < 0.05 versus nondiabetic control. †P < 0.05 versus diabetic control. For panel C, data were analyzed by Kruskal-Wallis tests followed by Mann-Whitney U tests. *P < 0.02 versus nondiabetic control. †P < 0.0001 versus diabetic control. N = 8–13 animals/group. Values are mean ± SEM.
FIG. 7.
FIG. 7.
GLO-I activity and mRNA, and MGO-AGE levels in diabetic Ren-2 rats. In Ren-2 rats after 4 weeks of diabetes, retinal GLO-I activity (A) is reduced compared with nondiabetic control and tends to be restored with Cand, although this is not significant (*P < 0.03 vs. nondiabetic Ren-2 control). In Ren-2 rats after 20 weeks of diabetes, retinal GLO-I mRNA (B) is clearly reduced compared with nondiabetic control and is restored to control levels with Cand (*P < 0.005 vs. nondiabetic Ren-2 control, †P < 0.05 vs. diabetic Ren-2 control). In comparison, in Sprague-Dawley (SD) rats (B), no changes in retinal GLO-I mRNA are observed with 20 weeks of diabetes. In Ren-2 rats after 4 weeks of diabetes, the reduction in retinal GLO-I activity (A) is accompanied by an increase in the levels of retinal MGO-AGE (C), (*P < 0.01 vs. nondiabetic Ren-2 control). In diabetic Ren-2 rats, Cand tends to decrease the levels of retinal MGO-AGE, but this is not significant. In diabetic Ren-2 rats at 4 weeks, the levels in retina of the specific MGO-AGE, argpyrimidine (D), and NO levels (E) are unchanged compared with nondiabetic controls; however, Cand reduced retinal argpyrimidine (*P < 0.05 vs. nondiabetic Ren-2 control, †P < 0.01 vs. diabetic Ren-2 control) and NO levels (*P < 0.05 vs. nondiabetic Ren-2 control. †P < 0.01 vs. diabetic Ren-2 control). F: Plasma MGO-AGEs (black bars) are increased in Ren-2 rats after 20 weeks of diabetes compared with nondiabetic controls and are reduced with Cand to nondiabetic levels (*P < 0.05 vs. nondiabetic Ren-2 control; †P < 0.05 vs. diabetic Ren-2 control). Other AGEs (non-MGO AGEs, white bars) and total AGEs (MGO-AGE + other AGEs, black + white bars) were increased in Ren-2 rats after 20 weeks of diabetes and reduced with Cand to nondiabetic control levels (‡P < 0.005 versus “other AGE” nondiabetic Ren-2 control; §P < 0.04 versus “other AGE” diabetic Ren-2 control; #P < 0.02 versus “total AGE” nondiabetic Ren-2 control; **P < 0.02 versus “total AGE” diabetic Ren-2 control). N = 5–8 animals/group. Values are mean ± SEM. Data in panels C and D were analyzed by one-way ANOVA, followed by Bonferroni post hoc tests. All other datasets in this figure were analyzed by Kruskal-Wallis tests, followed by Mann-Whitney U tests.
FIG. 8.
FIG. 8.
Proposed mechanism by which Ang II downregulates GLO-I in retinal vascular cells, leading to the generation of AGEs and vascular injury. The AT1-RB, Cand, is able to prevent diabetic retinal vascular injury by reducing nitric oxide and restoring GLO-I levels.

Similar articles

Cited by

References

    1. The Diabetes Control and Complications Trial Research Group The effect of intensive treatment of diabetes on the development and progression of long-term complications in insulin-dependent diabetes mellitus. N Engl J Med 1993;329:977–986 - PubMed
    1. Yamagishi S, Amano S, Inagaki Y, Okamoto T, Koga K, Sasaki N, Yamamoto H, Takeuchi M, Makita Z: Advanced glycation end products-induced apoptosis and overexpression of vascular endothelial growth factor in bovine retinal pericytes. Biochem Biophys Res Commun 2002;290:973–978 - PubMed
    1. Stitt AW, Li YM, Gardiner TA, Bucala R, Archer DB, Vlassara H: Advanced glycation end products (AGEs) co-localize with AGE receptors in the retinal vasculature of diabetic and of AGE-infused rats. Am J Pathol 1997;150:523–531 - PMC - PubMed
    1. Wilkinson-Berka JL: Angiotensin and diabetic retinopathy. Int J Biochem Cell Biol 2006;38:752–765 - PubMed
    1. Thornalley PJ: The glyoxalase system: new developments towards functional characterization of a metabolic pathway fundamental to biological life. Biochem J 1990;269:1–11 - PMC - PubMed

Publication types

MeSH terms