

Myocardial insulin resistance induced by high fat feeding in heart failure is associated with preserved contractile function
- PMID: 20852054
- PMCID: PMC3006284
- DOI: 10.1152/ajpheart.00687.2010
Myocardial insulin resistance induced by high fat feeding in heart failure is associated with preserved contractile function
Abstract
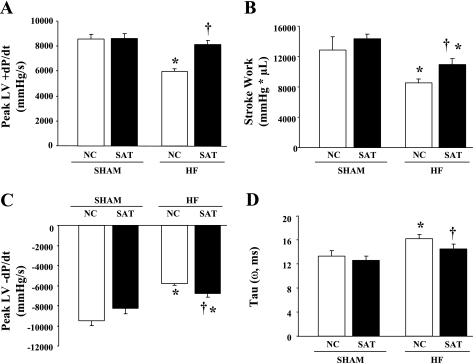
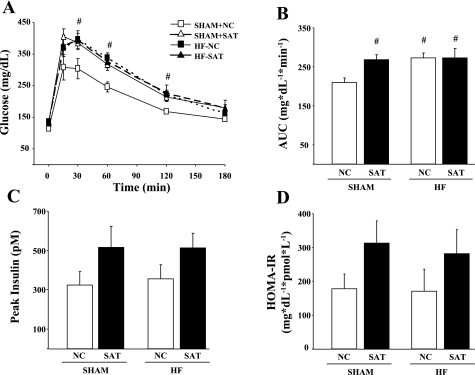
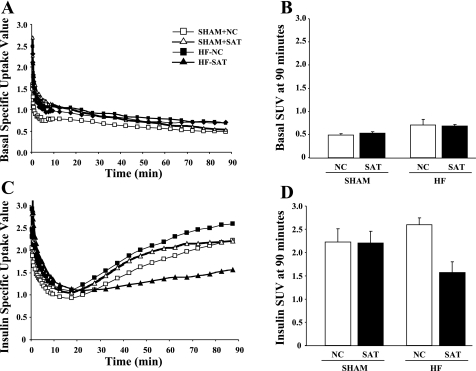
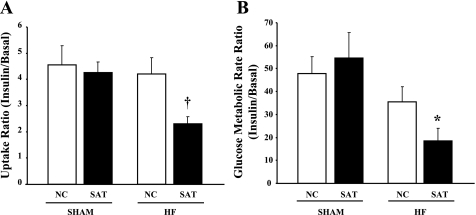
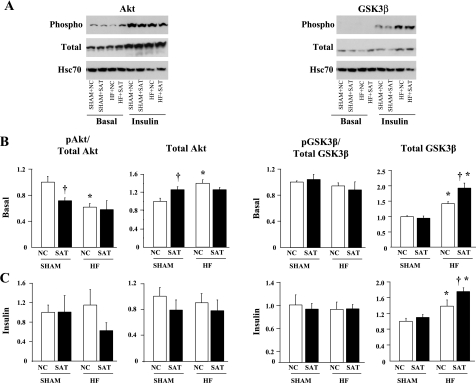
Previous studies have reported that high fat feeding in mild to moderate heart failure (HF) results in the preservation of contractile function. Recent evidence has suggested that preventing the switch from fatty acid to glucose metabolism in HF may ameliorate dysfunction, and insulin resistance is one potential mechanism for regulating substrate utilization. This study was designed to determine whether peripheral and myocardial insulin resistance exists with HF and/or a high-fat diet and whether myocardial insulin signaling was altered accordingly. Rats underwent coronary artery ligation (HF) or sham surgery and were randomized to normal chow (NC; 14% kcal from fat) or a high-fat diet (SAT; 60% kcal from fat) for 8 wk. HF + SAT animals showed preserved systolic (+dP/dt and stroke work) and diastolic (-dP/dt and time constant of relaxation) function compared with HF + NC animals. Glucose tolerance tests revealed peripheral insulin resistance in sham + SAT, HF + NC, and HF + SAT animals compared with sham + NC animals. PET imaging confirmed myocardial insulin resistance only in HF + SAT animals, with an uptake ratio of 2.3 ± 0.3 versus 4.6 ± 0.7, 4.3 ± 0.4, and 4.2 ± 0.6 in sham + NC, sham + SAT, and HF + NC animals, respectively; the myocardial glucose utilization rate was similarly decreased in HF + SAT animals only. Western blot analysis of insulin signaling protein expression was indicative of cardiac insulin resistance in HF + SAT animals. Specifically, alterations in Akt and glycogen synthase kinase-3β protein expression in HF + SAT animals compared with HF + NC animals may be involved in mediating myocardial insulin resistance. In conclusion, HF animals fed a high-saturated fat exhibited preserved myocardial contractile function, peripheral and myocardial insulin resistance, decreased myocardial glucose utilization rates, and alterations in cardiac insulin signaling. These results suggest that myocardial insulin resistance may serve a cardioprotective function with high fat feeding in mild to moderate HF.
Figures
Similar articles
-
The myocardial contractile response to physiological stress improves with high saturated fat feeding in heart failure.Am J Physiol Heart Circ Physiol. 2010 Aug;299(2):H410-21. doi: 10.1152/ajpheart.00270.2010. Epub 2010 May 28. Am J Physiol Heart Circ Physiol. 2010. PMID: 20511406 Free PMC article.
-
Changes in myofilament proteins, but not Ca²⁺ regulation, are associated with a high-fat diet-induced improvement in contractile function in heart failure.Am J Physiol Heart Circ Physiol. 2011 Oct;301(4):H1438-46. doi: 10.1152/ajpheart.00440.2011. Epub 2011 Jul 15. Am J Physiol Heart Circ Physiol. 2011. PMID: 21765056 Free PMC article.
-
Enhanced acyl-CoA dehydrogenase activity is associated with improved mitochondrial and contractile function in heart failure.Cardiovasc Res. 2008 Jul 15;79(2):331-40. doi: 10.1093/cvr/cvn066. Epub 2008 Mar 13. Cardiovasc Res. 2008. PMID: 18339649
-
Myocardial fatty acid metabolism and cardiac performance in heart failure.Curr Cardiol Rep. 2008 Mar;10(2):142-8. doi: 10.1007/s11886-008-0024-2. Curr Cardiol Rep. 2008. PMID: 18417015 Review.
-
A "PET" area of interest: myocardial metabolism in human systolic heart failure.Heart Fail Rev. 2013 Sep;18(5):567-74. doi: 10.1007/s10741-012-9360-9. Heart Fail Rev. 2013. PMID: 23180281 Free PMC article. Review.
Cited by
-
Insulin resistance protects the heart from fuel overload in dysregulated metabolic states.Am J Physiol Heart Circ Physiol. 2013 Dec;305(12):H1693-7. doi: 10.1152/ajpheart.00854.2012. Epub 2013 Oct 4. Am J Physiol Heart Circ Physiol. 2013. PMID: 24097426 Free PMC article. Review.
-
Insulin Signaling and Heart Failure.Circ Res. 2016 Apr 1;118(7):1151-69. doi: 10.1161/CIRCRESAHA.116.306206. Circ Res. 2016. PMID: 27034277 Free PMC article. Review.
-
A high fat diet increases mitochondrial fatty acid oxidation and uncoupling to decrease efficiency in rat heart.Basic Res Cardiol. 2011 May;106(3):447-57. doi: 10.1007/s00395-011-0156-1. Epub 2011 Feb 12. Basic Res Cardiol. 2011. PMID: 21318295 Free PMC article.
-
Natriuretic peptide receptor C contributes to disproportionate right ventricular hypertrophy in a rodent model of obesity-induced heart failure with preserved ejection fraction with pulmonary hypertension.Pulm Circ. 2019 Dec 18;9(4):2045894019878599. doi: 10.1177/2045894019895452. eCollection 2019 Oct-Dec. Pulm Circ. 2019. PMID: 31903184 Free PMC article.
-
Body adiposity dictates different mechanisms of increased coronary reactivity related to improved in vivo cardiac function.Cardiovasc Diabetol. 2014 Feb 27;13:54. doi: 10.1186/1475-2840-13-54. Cardiovasc Diabetol. 2014. PMID: 24572210 Free PMC article.
References
-
- AlZadjali MA, Godfrey V, Khan F, Choy A, Doney AS, Wong AK, Petrie JR, Struthers AD, Lang CC. Insulin resistance is highly prevalent and is associated with reduced exercise tolerance in nondiabetic patients with heart failure. J Am Coll Cardiol 53: 747–753, 2009 - PubMed
-
- Ashrafian H, Frenneaux MP, Opie LH. Metabolic mechanisms in heart failure. Circulation 116: 434–448, 2007 - PubMed
-
- Barger PM, Kelly DP. Fatty acid utilization in the hypertrophied and failing heart: molecular regulatory mechanisms. Am J Med Sci 318: 36–42, 1999 - PubMed
-
- Belke DD, Betuing S, Tuttle MJ, Graveleau C, Young ME, Pham M, Zhang D, Cooksey RC, McClain DA, Litwin SE, Taegtmeyer H, Severson D, Kahn CR, Abel ED. Insulin signaling coordinately regulates cardiac size, metabolism, and contractile protein isoform expression. J Clin Invest 109: 629–639, 2002 - PMC - PubMed
-
- Bulhak AA, Jung C, Ostenson CG, Lundberg JO, Sjoquist PO, Pernow J. PPAR-α activation protects the type 2 diabetic myocardium against ischemia-reperfusion injury: involvement of the PI3-kinase/Akt and NO pathway. Am J Physiol Heart Circ Physiol 296: H719–H727, 2009 - PubMed
Publication types
MeSH terms
Substances
Grants and funding
LinkOut - more resources
Full Text Sources
Medical
Research Materials
Miscellaneous