

Disruption of the chaperonin containing TCP-1 function affects protein networks essential for rod outer segment morphogenesis and survival
- PMID: 20852191
- PMCID: PMC3013443
- DOI: 10.1074/mcp.M110.000570
Disruption of the chaperonin containing TCP-1 function affects protein networks essential for rod outer segment morphogenesis and survival
Abstract
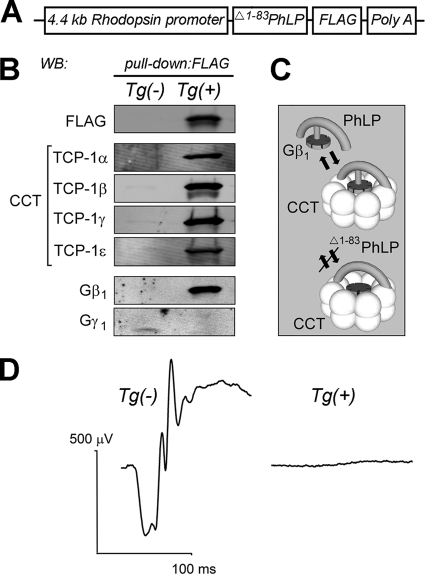
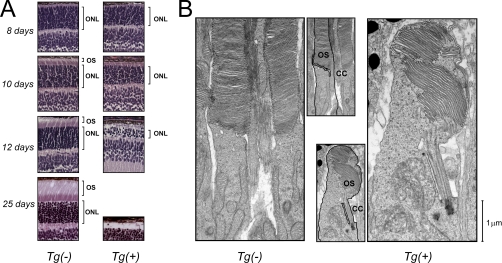
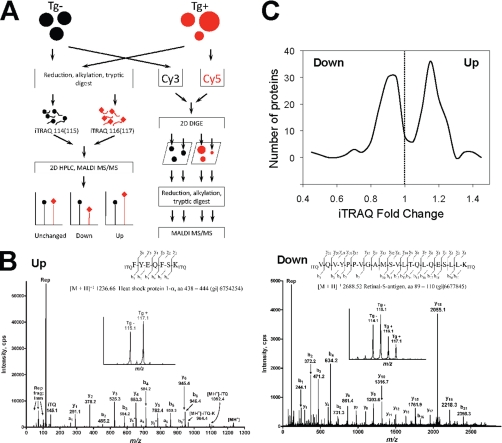
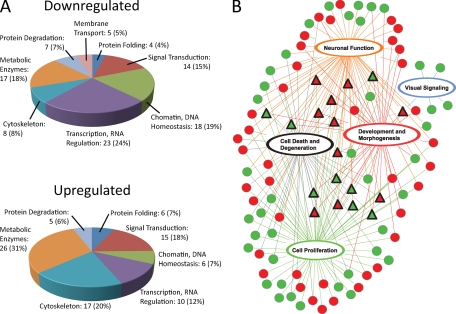
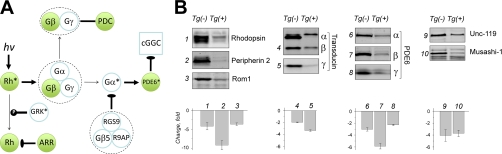
Type II Chaperonin Containing TCP-1 (CCT, also known as TCP-1 Ring Complex, TRiC) is a multi-subunit molecular machine thought to assist in the folding of ∼ 10% of newly translated cytosolic proteins in eukaryotes. A number of proteins folded by CCT have been identified in yeast and cultured mammalian cells, however, the function of this chaperonin in vivo has never been addressed. Here we demonstrate that suppressing the CCT activity in mouse photoreceptors by transgenic expression of a dominant-negative mutant of the CCT cofactor, phosducin-like protein (PhLP), results in the malformation of the outer segment, a cellular compartment responsible for light detection, and triggers rapid retinal degeneration. Investigation of the underlying causes by quantitative proteomics identified distinct protein networks, encompassing ∼ 200 proteins, which were significantly affected by the chaperonin deficiency. Notably among those were several essential proteins crucially engaged in structural support and visual signaling of the outer segment such as peripherin 2, Rom1, rhodopsin, transducin, and PDE6. These data for the first time demonstrate that normal CCT function is ultimately required for the morphogenesis and survival of sensory neurons of the retina, and suggest the chaperonin CCT deficiency as a potential, yet unexplored, cause of neurodegenerative diseases.
Figures
Similar articles
-
Essential role of the chaperonin CCT in rod outer segment biogenesis.Invest Ophthalmol Vis Sci. 2014 May 22;55(6):3775-85. doi: 10.1167/iovs.14-13889. Invest Ophthalmol Vis Sci. 2014. PMID: 24854858 Free PMC article.
-
Structure of the complex between the cytosolic chaperonin CCT and phosducin-like protein.Proc Natl Acad Sci U S A. 2004 Dec 14;101(50):17410-5. doi: 10.1073/pnas.0405070101. Epub 2004 Dec 6. Proc Natl Acad Sci U S A. 2004. PMID: 15583139 Free PMC article.
-
TRiC/CCT Chaperonin: Structure and Function.Subcell Biochem. 2019;93:625-654. doi: 10.1007/978-3-030-28151-9_19. Subcell Biochem. 2019. PMID: 31939165 Review.
-
The structural basis of eukaryotic chaperonin TRiC/CCT: Action and folding.Mol Cells. 2024 Mar;47(3):100012. doi: 10.1016/j.mocell.2024.100012. Epub 2024 Jan 26. Mol Cells. 2024. PMID: 38280673 Free PMC article. Review.
-
Folding of large multidomain proteins by partial encapsulation in the chaperonin TRiC/CCT.Proc Natl Acad Sci U S A. 2012 Dec 26;109(52):21208-15. doi: 10.1073/pnas.1218836109. Epub 2012 Nov 28. Proc Natl Acad Sci U S A. 2012. PMID: 23197838 Free PMC article.
Cited by
-
PDCL2 is essential for spermiogenesis and male fertility in mice.Cell Death Discov. 2022 Oct 17;8(1):419. doi: 10.1038/s41420-022-01210-2. Cell Death Discov. 2022. PMID: 36253364 Free PMC article.
-
Transsynaptic Binding of Orphan Receptor GPR179 to Dystroglycan-Pikachurin Complex Is Essential for the Synaptic Organization of Photoreceptors.Cell Rep. 2018 Oct 2;25(1):130-145.e5. doi: 10.1016/j.celrep.2018.08.068. Cell Rep. 2018. PMID: 30282023 Free PMC article.
-
Splice isoforms of phosducin-like protein control the expression of heterotrimeric G proteins.J Biol Chem. 2013 Sep 6;288(36):25760-25768. doi: 10.1074/jbc.M113.486258. Epub 2013 Jul 25. J Biol Chem. 2013. PMID: 23888055 Free PMC article.
-
Characterization of CCTα and evaluating its expression in the mud crab Scylla paramamosain when challenged by low temperatures alone and in combination with high and low salinity.Cell Stress Chaperones. 2015 Sep;20(5):853-64. doi: 10.1007/s12192-015-0612-1. Epub 2015 Jun 30. Cell Stress Chaperones. 2015. PMID: 26122201 Free PMC article.
-
Interaction of transducin with uncoordinated 119 protein (UNC119): implications for the model of transducin trafficking in rod photoreceptors.J Biol Chem. 2011 Aug 19;286(33):28954-28962. doi: 10.1074/jbc.M111.268821. Epub 2011 Jun 28. J Biol Chem. 2011. PMID: 21712387 Free PMC article.
References
-
- Clarke A. R. (2006) Cytosolic chaperonins: a question of promiscuity. Mol. Cell 24, 165–167 - PubMed
-
- Valpuesta J. M., Martín-Benito J., Gómez-Puertas P., Carrascosa J. L., Willison K. R. (2002) Structure and function of a protein folding machine: the eukaryotic cytosolic chaperonin CCT. FEBS Lett. 529, 11–16 - PubMed
-
- Mummert E., Grimm R., Speth V., Eckerskorn C., Schiltz E., Gatenby A. A., Schäfer E. (1993) A TCP1-related molecular chaperone from plants refolds phytochrome to its photoreversible form. Nature 363, 644–648 - PubMed
Publication types
MeSH terms
Substances
Grants and funding
LinkOut - more resources
Full Text Sources
Molecular Biology Databases
