. 2010 Oct;120(10):3443-54.
doi: 10.1172/JCI40905. Epub 2010 Sep 13.

PPARγ-induced cardiolipotoxicity in mice is ameliorated by PPARα deficiency despite increases in fatty acid oxidation

Affiliations

PPARγ-induced cardiolipotoxicity in mice is ameliorated by PPARα deficiency despite increases in fatty acid oxidation

Ni-Huiping Son et al. J Clin Invest. 2010 Oct.

Erratum in

  • J Clin Invest. 2010 Dec 1;120(12):4583

Abstract

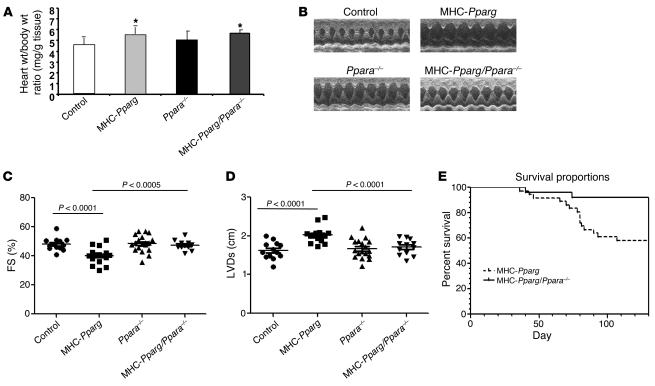
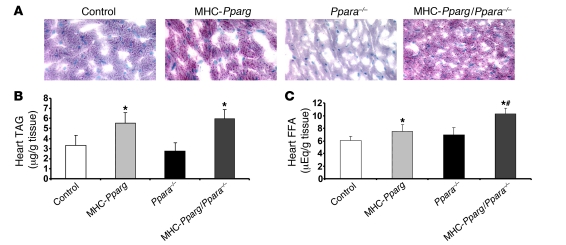
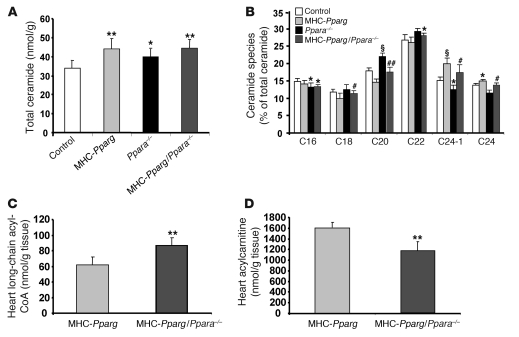
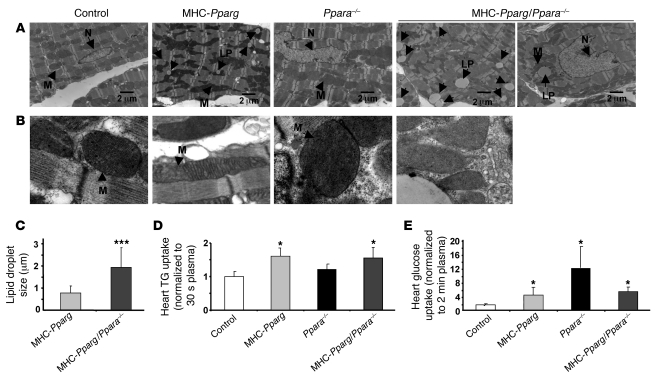
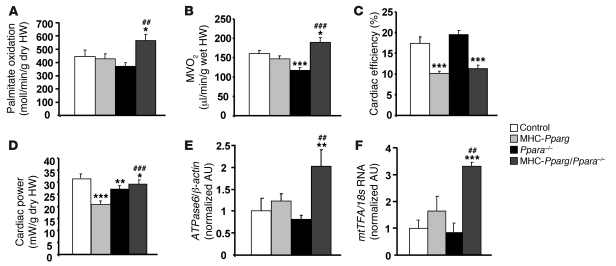
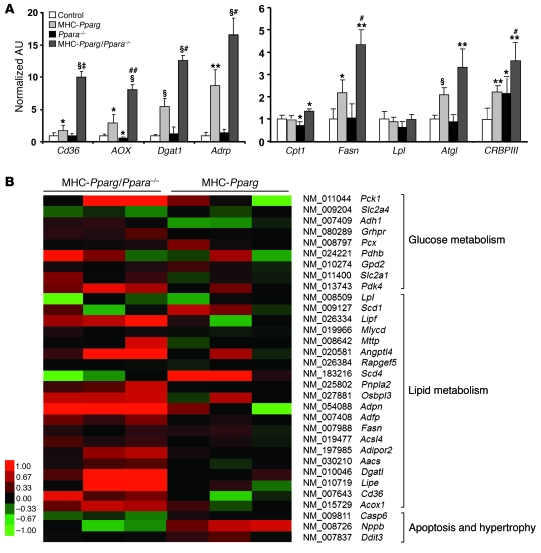
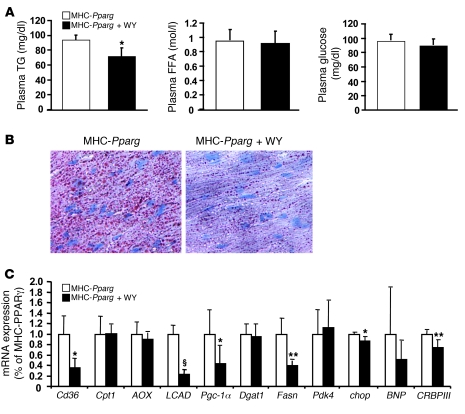
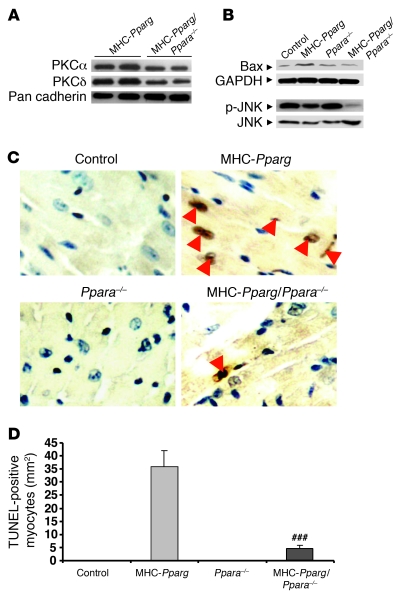
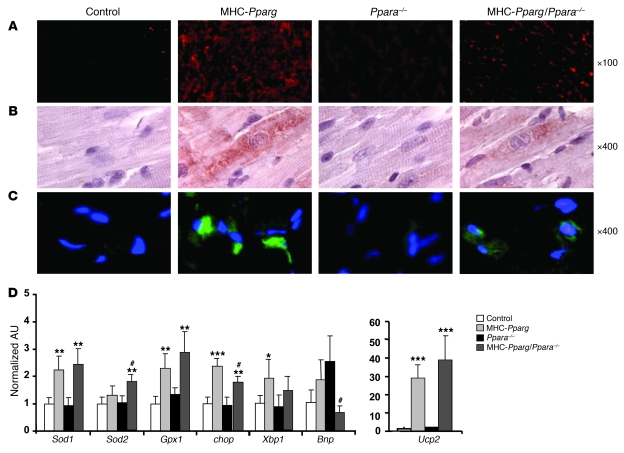
Excess lipid accumulation in the heart is associated with decreased cardiac function in humans and in animal models. The reasons are unclear, but this is generally believed to result from either toxic effects of intracellular lipids or excessive fatty acid oxidation (FAO). PPARγ expression is increased in the hearts of humans with metabolic syndrome, and use of PPARγ agonists is associated with heart failure. Here, mice with dilated cardiomyopathy due to cardiomyocyte PPARγ overexpression were crossed with PPARα-deficient mice. Surprisingly, this cross led to enhanced expression of several PPAR-regulated genes that mediate fatty acid (FA) uptake/oxidation and triacylglycerol (TAG) synthesis. Although FA oxidation and TAG droplet size were increased, heart function was preserved and survival improved. There was no marked decrease in cardiac levels of triglyceride or the potentially toxic lipids diacylglycerol (DAG) and ceramide. However, long-chain FA coenzyme A (LCCoA) levels were increased, and acylcarnitine content was decreased. Activation of PKCα and PKCδ, apoptosis, ROS levels, and evidence of endoplasmic reticulum stress were also reduced. Thus, partitioning of lipid to storage and oxidation can reverse cardiolipotoxicity despite increased DAG and ceramide levels, suggesting a role for other toxic intermediates such as acylcarnitines in the toxic effects of lipid accumulation in the heart.


Figures

Figure 1
Figure 1. PPARα deficiency improved heart function and increased survival rates in MHC-Pparg mice.
(A) Heart weight to body weight ratio in mice (n = 11–18). (B) Representative M-mode echocardiographic images of LVD in MHC-Pparg and MHC-Pparg/Ppara–/– mice. (C and D) Echocardiography showed increased FS and reduced LVDs in MHC-Pparg/Ppara–/– mice (n = 11–18). (E) Survival was increased in MHC-Pparg/Ppara–/– mice. Data are shown as mean ± SD. *P < 0.05 versus normal controls.
Figure 2
Figure 2. Accumulation of intracellular lipid in the heart of MHC-Pparg and MHC-Pparg/Ppara–/– mice.
(A) Oil red O staining showed an abundance of neutral lipid droplets randomly scattered throughout the cytoplasm of cardiomyocytes in both MHC-Pparg and MHC-Pparg/Ppara–/– mice after overnight fasting (original magnification, ×200). (B) Heart TAG and (C) FFA content were significantly increased in both MHC-Pparg and MHC-Pparg/Ppara–/– mice compared with control mice (n = 7). Data are shown as mean ± SD. *P < 0.05 versus littermate controls; #P < 0.05 versus MHC-Pparg mice.
Figure 3
Figure 3. Total ceramide, long-chain acyl-CoA, and acylcarnitine content in hearts of MHC-Pparg and MHC-Pparg/Ppara–/– mice.
(A) Total ceramide and (B) individual ceramide species. Ceramide species data represent the content of each FA as a percentage of total ceramide and are shown as mean ± SD (n = 6–7 per group). (C) Total long-chain acyl-CoA and (D) acetylcarnitine content. Data are shown as mean ± SD. *P < 0.01, **P < 0.01, and §P < 0.001 versus controls; #P < 0.05, ##P < 0.01 versus MHC-Pparg mice.
Figure 4
Figure 4. Increase in heart lipid droplet size and TG uptake in MHC-Pparg/Ppara–/– mice.
(A) Increase in lipid droplets within the sarcoplasm of cardiomyocytes in both MHC-Pparg and MHC-Pparg/Ppara–/– mice (original magnification, ×5,000). Increase in lipid droplet size (right 2 panels) and larger lipid droplets in MHC-Pparg/Ppara–/– surrounded by mitochondria (far right). Scale bars: 2 μm. (B) In MHC-Pparg heart mitochondria, the cristae were disrupted (original magnification, ×50,000). (C) The lipid droplet size was determined by randomly counting 50 lipid droplets, and average size is shown. (D) Cardiac TG-VLDL uptake and (E) 2-deoxy-d-[3H]glucose uptake. LP, lipid droplet; M, mitochondria; N, nucleus. Data are shown as mean ± SD. *P < 0.05, ***P < 0.001 versus MHC-Pparg mice.
Figure 5
Figure 5. Determination of cardiac lipid oxidation and mitochondria DNA number.
(A) Myocardial palmitate oxidation, (B) myocardial oxygen consumption, (C) cardiac efficiency, and (D) cardiac power in isolated working hearts (n = 4–5). (E) Heart mitochondrial DNA was quantified by calculating the ratio of mitochondrial gene copy number (ATPase6) to nuclear gene copy number (β-actin) (n = 7). (F) Heart mtTFA mRNA expression. Data are shown as mean ± SD. *P < 0.05, **P < 0.01, and ***P < 0.001 compared with littermate controls; ##P < 0.01, ###P < 0.001 compared with MHC-Pparg mice. HW, heart weight.
Figure 6
Figure 6. Heart tissue mRNA expression.
(A) qRT-PCR analysis of mRNA expression using gene-specific primers. Data were normalized to 18s rRNA. Values represent fold change relative to wild-type controls, which was set as 1 (n = 5–8). Data are shown as mean ± SD. *P < 0.05, **P < 0.01, and §P < 0.001 compared with controls; #P < 0.05, ##P < 0.01, and P < 0.001 compared with MHC-Pparg mice. (B) Clustering of gene expression in MHC-Pparg and MHC-Pparg/Ppara–/– mice. Clustering was performed using centered correlation as distance measure and average linkage as method. For the color bar scale, the numeric value is the gene-specific log10 difference in probe intensity from median probe intensity of all 6 samples.
Figure 7
Figure 7. MHC-Pparg mice with or without WY-14,643 treatment.
(A) Plasma TG, FFA, and glucose concentrations in the mice. (B) Oil red O staining of hearts from 3-month-old MHC-Pparg mice with or without WY-14,643 treatment (original magnification, ×200). (C) qRT-PCR analysis of cardiac mRNA expression in MHC-Pparg mice with or without WY-14,643 treatment (n = 6–7 per group). The results were repeated in 2 independent experiments. Data are shown as mean ± SD. *P < 0.05, **P < 0.01, §P < 0.001 compared with nontreated MHC-Pparg mice.
Figure 8
Figure 8. Cardiac PKC content and apoptosis-related proteins.
(A) Representative Western blot image of membrane PKCα and PKCδ content. (B) BAX and p-JNK proteins in the heart. Pan-cadherin, Gapdh, and total JNK are shown as controls. (C) Cardiac ventricular tissues were stained for DNA fragmentation by TUNEL protocol (original magnification, ×200). Apoptotic cardiomyocytes containing fragmented nuclear chromatin exhibited dark brown nuclear staining (arrows). (D) The TUNEL-positive myocytes were counted and expressed as the number of TUNEL-positive myocytes per millimeter squared tissue area. Data are shown as mean ± SD. ###P < 0.0001 compared with MHC-Pparg mice.
Figure 9
Figure 9. Detection of ROS production and of mitochondrial and ER stress in heart tissues.
(A) Histological analysis of heart tissues using dihydroethidium staining to detect ROS (original magnification, ×100). (B) Mitochondrial stress was detected by immunohistochemical staining of heart tissue sections with antibodies against prohibitin protein (original magnification, ×400). (C) Immunofluorescence analysis of the heart tissues using disulfide isomerase antibody (original magnification, ×400). (D) qRT-PCR analysis of heart gene expression. Data were normalized to 18s RNA. Values represent fold change relative to wild-type controls, which was set as 1 (n = 5–8). Data are shown as mean ± SD. *P < 0.05, **P < 0.01, and ***P < 0.01 compared with littermate controls; #P < 0.05 compared with MHC-Pparg mice.

Comment in

Similar articles

Cited by

References

    1. Unger RH. Lipotoxic diseases. Annu Rev Med. 2002;53:319–336. doi: 10.1146/annurev.med.53.082901.104057. - DOI - PubMed
    1. Carvajal K, Moreno-Sanchez R. Heart metabolic disturbances in cardiovascular diseases. Arch Med Res. 2003;34(2):89–99. doi: 10.1016/S0188-4409(03)00004-3. - DOI - PubMed
    1. Finck BN, et al. A critical role for PPARalpha-mediated lipotoxicity in the pathogenesis of diabetic cardiomyopathy: modulation by dietary fat content. Proc Natl Acad Sci U S A. 2003;100(3):1226–1231. doi: 10.1073/pnas.0336724100. - DOI - PMC - PubMed
    1. Finck BN, et al. The cardiac phenotype induced by PPARalpha overexpression mimics that caused by diabetes mellitus. J Clin Invest. 2002;109(1):121–130. - PMC - PubMed
    1. Schaffer JE. Lipotoxicity: when tissues overeat. Curr Opin Lipidol. 2003;14(3):281–287. doi: 10.1097/00041433-200306000-00008. - DOI - PubMed

Publication types