. 2010 Oct;13(10):1249-56.
doi: 10.1038/nn.2643. Epub 2010 Sep 19.

Opioid inhibition of N-type Ca2+ channels and spinal analgesia couple to alternative splicing

Affiliations

Opioid inhibition of N-type Ca2+ channels and spinal analgesia couple to alternative splicing

Arturo Andrade et al. Nat Neurosci. 2010 Oct.

Abstract

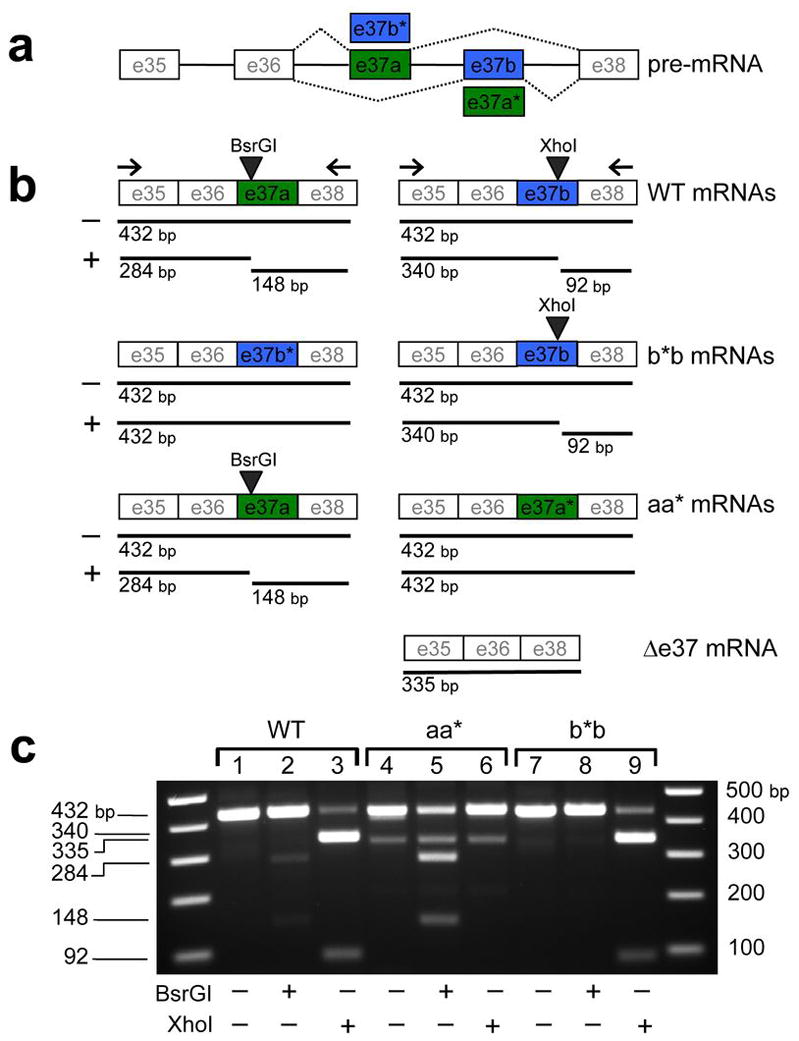
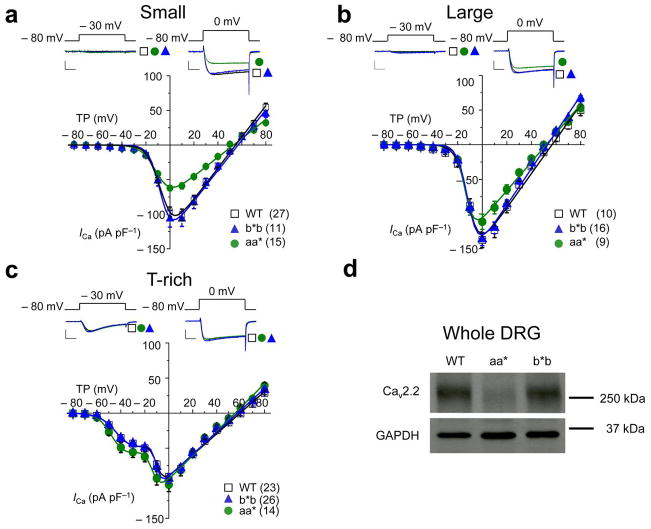
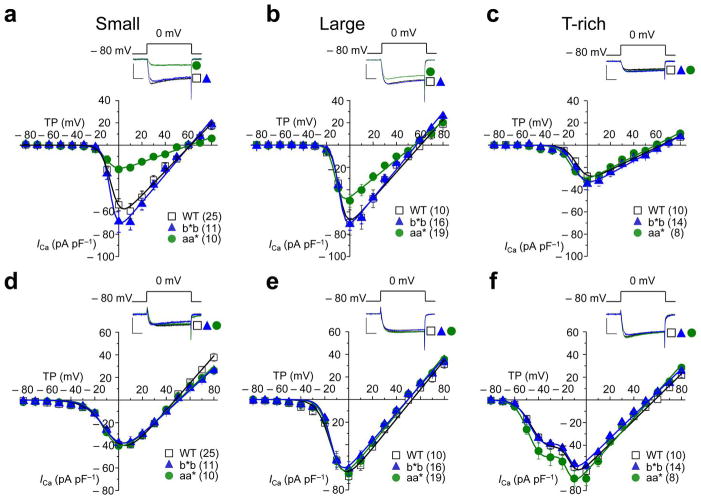
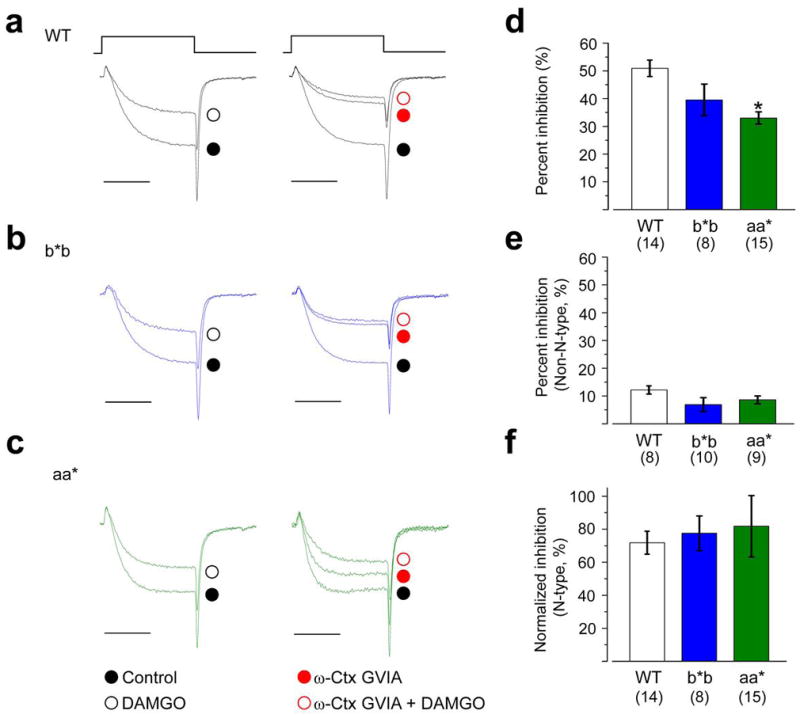
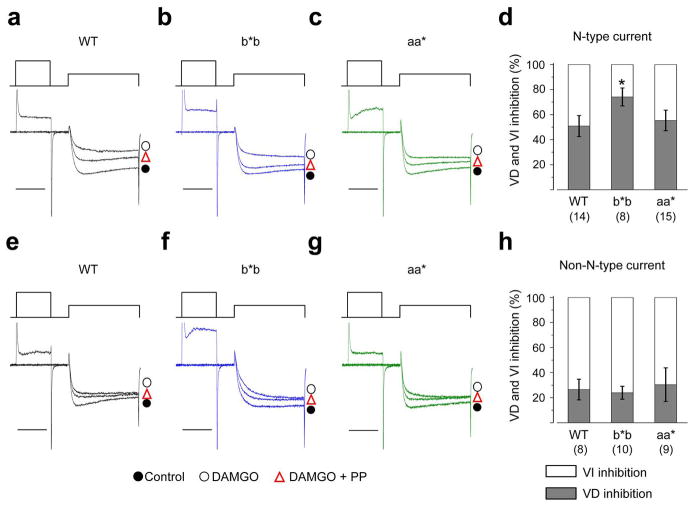
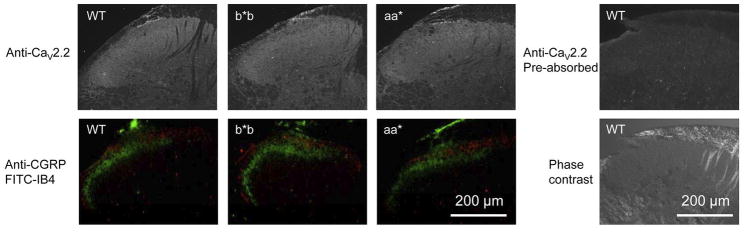
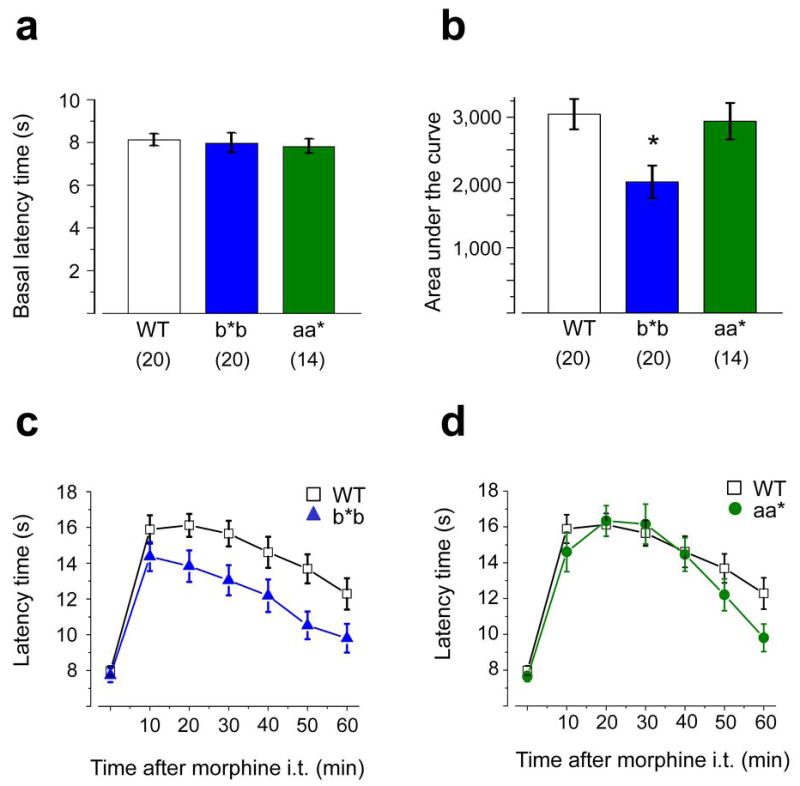
Alternative pre-mRNA splicing occurs extensively in the nervous systems of complex organisms, including humans, considerably expanding the potential size of the proteome. Cell-specific alternative pre-mRNA splicing is thought to optimize protein function for specialized cellular tasks, but direct evidence for this is limited. Transmission of noxious thermal stimuli relies on the activity of N-type Ca(V)2.2 calcium channels in nociceptors. Using an exon-replacement strategy in mice, we show that mutually exclusive splicing patterns in the Ca(V)2.2 gene modulate N-type channel function in nociceptors, leading to a change in morphine analgesia. Exon 37a (e37a) enhances μ-opioid receptor-mediated inhibition of N-type calcium channels by promoting activity-independent inhibition. In the absence of e37a, spinal morphine analgesia is weakened in vivo but the basal response to noxious thermal stimuli is not altered. Our data suggest that highly specialized, discrete cellular responsiveness in vivo can be attributed to alternative splicing events regulated at the level of individual neurons.


Conflict of interest statement

COMPETING FINANCIAL INTERESTS

The authors declare no competing financial interests

Figures

Figure 1
Figure 1. Exon 37-substitution in Cacna1b and resultant mRNAs in WT and mutant DRG
Schematic of Cacna1b gene showing mutually exclusive exons e37a (green) and e37b (blue) with constitutively expressed exons (e35, e36, and e38) (a). Exon replacement strategy illustrates predicted mRNAs (b). E37b* replaces e37a, and e37a* replaces e37b to generate Cacna1bb*b/b*b (b*b) and Cacna1baa*/aa* (aa*) mice, respectively. Sizes of predicted RT-PCR products using primers located in exons 35 and 38 from CaV2.2 mRNAs derived from DRG of WT, b*b, and aa* mice are shown. Sizes of PCR products undigested (−) and digested with BsrGI (+), and XhoI (+) are shown below each mRNA. Uncut cDNAs containing either e37a or e37b are 432 bp and cDNAs lacking either e37a or e37b (Δ37) are 335 bp. BsrGI cuts WT e37a generating 284 bp and 148 bp products and XhoI cuts WT e37b into 340 bp and 92 bp products. Mutant e37a* and mutant e37b*-containing sequences lack BsrGI and XhoI sites, respectively. Results of RT-PCR from 1 μg of total RNA isolated from mouse DRG of WT (lanes 1–3), aa* (lanes 4–6), and b*b(lanes 7–9) mice (c). PCR products untreated (lanes 1, 4, and 7) and treated with BsrGI (lanes 2, 5, and 8) or XhoI (lanes 3, 6, and 9) were separated on a 2% TAE agarose gel. 1 kb Plus DNA ladders flank lanes 1–9. A 335 bp product was amplified from DRG of aa* mice and was resistant to BsrGI and XhoI. Sequencing shows it corresponds to mRNA lacking e37 (Δ37).
Figure 2
Figure 2. Whole cell calcium current densities in DRG neurons of Cacna1bb*b/b*b mice are indistinguishable from WT
Average current-voltage relationships in three types of DRG neurons from WT, Cacna1bb*b/b*b (b*b), and Cacna1baa*/aa* (aa*) mice (a–c). Currents were evoked by test pulses to − 30 mV (left) and 0 mV (right) from a holding potential of − 80 mV. A series of currents were elicited by depolarizations applied every 10 seconds to test potentials between − 70 mV and + 80 mV from a holding potential of − 80 mV. Current densities are plotted (pA/pF) for small cells (a, 13pF), large cells (b, 35pF), and T-rich cells (c, 24pF). Calcium current densities of small (a) and large (b) neurons from Cacna1baa*/aa* mice are significantly smaller compared to WT mice. Individual current voltage plots were fit with one (a, c) and two (b) Boltzmann functions using average parameters calculated from fitting individual curves (Supplementary Table 2). Scale bars correspond to 500 pA and 5 ms. Data points are mean ±s.e.m. n values shown are number of cells, data sets contain recordings from at least 9 mice. (d) Western blot of DRG lysates derived from WT, aa*, and b*b mice using a polyclonal antibody directed to CaV2.2 and a monoclonal antibody directed to Glyceraldehyde 3-Phosphate Dehydrogenase (GAPDH). CaV2.2 protein levels in DRG of aa* mice were reduced compared to WT. CaV2.2 protein runs at 260 kDa, a dash indicates the location of a 250 kDa size marker. Complete, uncropped -l blots are shown in Supplementary Fig. 5.
Figure 3
Figure 3. N-type and non-N-type current densities in sensory neurons of Cacna1bb*b/b*b mice are indistinguishable from WT
Average N-type (ac) and non-N-type (df) calcium current voltage relationships in three sub-types (small, large, and T-rich) of acutely dissociated DRG neurons from wild-type (WT), Cacna1bb*b/b*b (b*b), and Cacna1baa*/aa* (aa*) mice (af). Representative currents shown above current voltage plots evoked by test pulses to 0 mV from a holding potential of − 80 mV, recorded from each cell type, and each mouse line. Currents were elicited as described in Fig. 2 and plotted as pA/pF to normalize for cell size. N-type currents and non-N-type currents correspond to ω-conotoxin GVIA-sensitive and insensitive components of the whole cell current, respectively. N-type currents were isolated in each cell by subtracting non-N-type (insensitive to 2 μM ω-Ctx GVIA) from whole cell currents. N-type current densities in small (a) and large (b) neurons are significantly smaller in Cacna1baa*/aa* compared to WT mice. Individual current voltage plots were fit with one (ae) and two (f) Boltzmann functions using average parameters calculated from fitting individual curves (Supplementary Table 2). Scale bars represent 500 pA and 5 ms. Data points are mean ±s.e.m. n values shown are number of cells but all data sets contain recordings from at least 9 mice.
Figure 4
Figure 4. DAMGO inhibits N-type currents similarly in nociceptors from all three genotypes
Representative currents from nociceptors isolated from WT (a), b*b (b), and aa* (c) mice show the inhibitory actions of a saturating concentration of 10 μM DAMGO on calcium currents in the absence (left; whole cell currents) and presence (right; non-N-type currents) of ω-Ctx GVIA (2 μM). For comparison, current amplitudes are scaled relative to their respective controls (ac). Currents were elicited by test pulses to 0 mV from a holding potential of − 80 mV. Scale bar corresponds to 5 ms. Average % inhibition by DAMGO in nociceptors of WT, b*b, and aa* mice in the absence (d; whole cell current) and presence (e; non-N-type current) of 2 μM ω-Ctx GVIA. Values shown are means ±s.e.m. n values are number of cells, all data sets contain recordings from at least 9 mice. DAMGO was significantly less effective at inhibiting whole cell currents in aa* mice compared to WT (d; P = 0.0432). DAMGO’s inhibition of N-type currents in nociceptors compared among the three genotypes (f). For comparison, because N-type current density was significantly smaller in nociceptors of aa* mice, ,% inhibition by DAMGO was normalized to N-type current density as follows: {[(IcontrolIDAMGO)whole cell − (ICtxIDAMGO)non-N-type]/IN-type} × 100%. Average values of ICtx, IDAMGO, and IN-type were obtained from nociceptors of WT (n = 8), b*b (n = 10), aa* (n = 9) mice for these calculations.
Figure 5
Figure 5. Voltage-independent inhibition by DAMGO is reduced in nociceptors that only express e37b and not e37a
Representative currents from small neurons isolated from WT (a, e), b*b (b, f), and aa* (c, g) mice show the inhibitory actions of 10 μM DAMGO on whole cell currents in the absence (ac; whole cell currents) and presence (e–g) of ω-Ctx GVIA (2 μM). Currents were elicited by test pulses to 0 mV from a holding potential of − 80 mV without and with a strong prepulse to +80 mV to remove voltage-dependent inhibition (ac, e–g). For comparison, current amplitudes are scaled relative to their respective controls. Scale bar corresponds to 5 ms. Relative amount of voltage-dependent and voltage-independent inhibition of N-type (d; P = 0.0321) and non-N-type (h) currents mediated by 10 μM DAMGO in recordings from nociceptors of WT, b*b, and aa* mice. Values shown are means ±s.e.m. n values shown are number of cells, all data sets contain recordings from at least 9 mouse lines. Percent voltage-independent inhibition of N-type current was estimated as follows: {(VIwhole-cell − VINon-N-type)/total N-type inhibition} × 100%. VI corresponds to the voltage-independent component of inhibition.
Figure 6
Figure 6. Anti-CaV2.2, anti-CGRP, and FITC-IB4 signals in superficial layers of dorsal spinal horn are similar among genotypes
Spinal cord sections from wild-type (WT), Cacna1bb*b/b*b (b*b), and Cacna1baa*/aa* (aa*) mice showing the dorsal spinal horn. The anti-CaV2.2 immunofluorescence signal is similar among the three genotypes (upper panels) as are the anti-CGRP (red signal, lower panels) and FITC-IB4 (green signal, lower panels). The lower panels show prominent CGRP and IB4 fluorescence in laminae I and II of the dorsal horn. CGRP and IB4 are often used to mark peptidergic and non-peptidergic nociceptive terminals, respectively , . A spinal cord section from WT incubated with the primary antibody pre-absorbed with the corresponding antigenic peptide is shown as control. Contrast phase image of the same section is also shown. The antigenic peptide control shows complete loss of CaV2.2 staining. The anti- CaV2.2 signal is seen throughout the dorsal spinal horn but there is an enhanced signal in the superficial laminae in the region of IB4 and CGRP signals.
Figure 7
Figure 7. Morphine’s spinal level analgesia is reduced in mice that lack e37a
Comparison of thermal pain thresholds in WT (n = 20), b*b (n = 20), and aa* (n = 14) mice before (a) and after (b, c, d) intrathecal morphine. a, Average, basal paw withdrawal latency times (Hargreaves’s test) in response to noxious thermal stimuli measured in WT, b*b, and aa* mice were not significantly different (2 way ANOVA or Student’s t test, P > 0.5). b, Comparison intrathecal morphine analgesia expressed as the integral of the maximum possible effect (MPE) for each group as follows: (PWLmorphine − PWLbaseline) ×100/(20 − PWLbaseline) to normalize for differences in baseline responsiveness among mice. Morphine is significantly less effective against thermal stimuli in b*b mice compared to WT mice (Student’s t test P = 0.004) but has similar efficacy in aa* compared to WT mice (Student’s t test, P = 0.77). c and d, Time course of morphine analgesia following intrathecal injection (3 μg) at time 0 in WT and b*b mice (c) and in WT and aa* mice (d) measured every 10 min for 60 min. The efficacy of morphine is reduced in b*b mice relative to WT. P values at 10, 20, 30, 40, 50, and 60 min were 0.613, 0.190, 0.043, 0.023, 0.061, 0.008, and 0.044, respectively comparing average responses in b*b and WT mice (Student’s two tailed t test; c). Values shown are averages ± s.e.m.

Similar articles

Cited by

References

    1. Lipscombe D. Neuronal proteins custom designed by alternative splicing. Curr Opin Neurobiol. 2005;15:358–363. - PubMed
    1. Li Q, Lee JA, Black DL. Neuronal regulation of alternative pre-mRNA splicing. Nat Rev Neurosci. 2007;8:819–831. - PubMed
    1. Ule J, Darnell RB. RNA binding proteins and the regulation of neuronal synaptic plasticity. Curr Opin Neurobiol. 2006;16:102–110. - PubMed
    1. Pan Q, Shai O, Lee LJ, Frey BJ, Blencowe BJ. Deep surveying of alternative splicing complexity in the human transcriptome by high-throughput sequencing. Nat Genet. 2008;40:1413–1415. - PubMed
    1. Dredge BK, Polydorides AD, Darnell RB. The splice of life: alternative splicing and neurological disease. Nat Rev Neurosci. 2001;2:43–50. - PubMed

Publication types

MeSH terms